Data sets for "Structure of molten NaCl and the decay of the pair-correlations"
Data sets used to prepare Figure 1 -14 in the Journal of Chemical Physics article entitled "Structure of molten NaCl and the decay of the pair-correlations." The data sets refer to the measured and simulated structure and thermodynamic properties of molten NaCl.
Cite this dataset as:
Salmon, P.,
Zeidler, A.,
2022.
Data sets for "Structure of molten NaCl and the decay of the pair-correlations".
Bath: University of Bath Research Data Archive.
Available from: https://doi.org/10.15125/BATH-01165.
Export
Data
Fig1_conditioning.agr
text/plain (109kB)
Creative Commons: Attribution 4.0
Figure 1 shows the k-dependence of the singular values sigma_l (l = 1, 2 or 3) and the condition numbers kappa_2 and kappa_2' for the Faber-Ziman (FZ) (left column) and Bhatia-Thortnon (BT) (right column) partial structure factors.
Fig2_n0+newpim_v3.agr
text/plain (35kB)
Creative Commons: Attribution 4.0
Figure 2 shows the temperature dependence of the atomic number density of the melt from experiment and from molecular dynamics simulations.
Fig3_totals.agr
text/plain (50kB)
Creative Commons: Attribution 4.0
Figure 3 shows neutron total structure factors ^{35}F(k) and ^{nat}F(k) and the difference function Delta F(k) measured for NaCl at 1093 K compared to the x-ray total structure factor S_X(k) measured for NaCl at 1091~K. Also shown is the S_X(k) function measured for NaCl at 1083~K in the work of Ohno and Furukawa.
Fig4_sk_pim … forpaper_v2.agr
text/plain (171kB)
Creative Commons: Attribution 4.0
Figure 4 shows the Faber-Ziman partial structure factors from the present diffraction work at T = 1093 K, the neutron diffraction work of Biggin and Enderby at T = 1148 K and the polarizable ion model (PIM) simulation at T = 1100 K.
Fig5a_snn+expt+fit_v2.agr
text/plain (86kB)
Creative Commons: Attribution 4.0
Figure 5a shows the BT partial structure factor S^{BT}_{NN}(k) from experiment at T = 1100 K and the PIM simulation at T = 1100 K. Also shown is the breakdown of the simulated function into its contributions from the weighted Faber-Ziman partial structure factors S^{FZ}_{ClCl}(k), S^{FZ}_{NaCl}(k) and S^{FZ}_{NaNa}(k). The inset highlights the measured and simulated BT functions at low-k, plotted as a function of k^2 in order to extract the low-order moments by fitting a straight line.
Fig5b_scc+expt … ected+fit_v2.agr
text/plain (87kB)
Creative Commons: Attribution 4.0
Figure 5b shows the BT partial structure factor S^{BT}_{CC}(k) from experiment at T = 1100 K and the PIM simulation at T = 1100 K. Also shown is the breakdown of the simulated function into its contributions from the weighted Faber-Ziman partial structure factors S^{FZ}_{ClCl}(k), S^{FZ}_{NaCl}(k) and S^{FZ}_{NaNa}(k). The inset highlights the measured and simulated BT functions at low-k, plotted as a function of k^2 in order to extract the low-order moments by fitting a straight line.
Fig5c_snc+expt+fit_v2.agr
text/plain (86kB)
Creative Commons: Attribution 4.0
Figure 5b shows the BT partial structure factor S^{BT}_{NC}(k) from experiment at T = 1100 K and the PIM simulation at T = 1100 K. Also shown is the breakdown of the simulated function into its contributions from the weighted Faber-Ziman partial structure factors S^{FZ}_{ClCl}(k), S^{FZ}_{NaCl}(k) and S^{FZ}_{NaNa}(k). The inset highlights the measured and simulated BT functions at low-k, plotted as a function of k^2 in order to extract the low-order moments by fitting a straight line.
Fig6_rdf_pim+expt_forpaper_v4.agr
text/plain (917kB)
Creative Commons: Attribution 4.0
Figure 6 shows the partial pair-distribution functions from the present diffraction work at T = 1093 K, the neutron diffraction work of Biggin and Enderby at T = 1148 K and the PIM simulation at T = 1100 K.
Fig8_bt_moments_1100k.agr
text/plain (185kB)
Creative Commons: Attribution 4.0
Figure 8 shows the running moments ^{run}M_{IJ}^(0)(r_{max}) from the PIM simulations at T = 1100 K for IJ= NN, CC and NC.
Fig9_compress+expt_v3.agr
text/plain (40kB)
Creative Commons: Attribution 4.0
Figure 9 shows the temperature dependence of the isothermal compressibility.
Fig10_sal_2rim+pim_v3.agr
text/plain (141kB)
Creative Commons: Attribution 4.0
Figure 10 shows the Faber-Ziman partial structure factors calculated for molten NaCl at T=1100 K using the PIM, rigid ion model 1 (RIM1) and rigid ion model 2 (RIM2).
Fig11a_snn+expt_rim+pim+inset_v2.agr
text/plain (140kB)
Creative Commons: Attribution 4.0
Figure 11a shows the number-number Bhatia-Thornton partial structure factor calculated for molten NaCl at T = 1100 K using the PIM, RIM1 and RIM2. Also shown is the function measured in the present diffraction work. The inset zooms into the low-k region of the simulated and measured functions.
Fig11b_scc+expt_rim+pim_v2.agr
text/plain (140kB)
Creative Commons: Attribution 4.0
Figure 11b shows the concentration-concentration Bhatia-Thornton partial structure factor calculated for molten NaCl at T = 1100 K using the PIM, RIM1 and RIM2. Also shown is the function measured in the present diffraction work. The inset zooms into the low-k region of the simulated and measured functions.
Fig11c_snc+expt_rim+pim_v2.agr
text/plain (107kB)
Creative Commons: Attribution 4.0
Figure 11c shows the number-concentration Bhatia-Thornton partial structure factor calculated for molten NaCl at T = 1100 K using the PIM, RIM1 and RIM2. Also shown is the function measured in the present diffraction work.
Fig12_rh_rim2+fits_v2.agr
text/plain (459kB)
Creative Commons: Attribution 4.0
Figure 12 shows the total pair correlation functions obtained from the RIM2 simulations at T = 1100 K.
Fig13a_rhnn_4t.agr
text/plain (351kB)
Creative Commons: Attribution 4.0
Figure 13a shows the temperature dependence of the BT total pair-correlation function rh^{BT}_{NN}(r) from the PIM simulations fitted to Eq.~(42).
Fig13b_rhcc_4t.agr
text/plain (332kB)
Creative Commons: Attribution 4.0
Figure 13b shows the temperature dependence of the BT total pair-correlation function rh^{BT}_{CC}(r) from the PIM simulations fitted to Eq.~(42).
Fig13c_rhnc_4t.agr
text/plain (341kB)
Creative Commons: Attribution 4.0
Figure 13c shows the temperature dependence of the BT total pair-correlation function rh^{BT}_{NC}(r) from the PIM simulations fitted to Eq.~(42).
Fig14_ero_fits_v2.agr
text/plain (18kB)
Creative Commons: Attribution 4.0
Figure 14 shows the temperature dependence of the decay length [a_0^{IJ}]^{-1} of Eq.~(42). The values from the PIM simulations at several different temperatures are compared to the values from the diffraction experiment at T = 1093 K.
Fig7a_gnn_v3.jpg
image/jpeg (281kB)
Creative Commons: Attribution 4.0
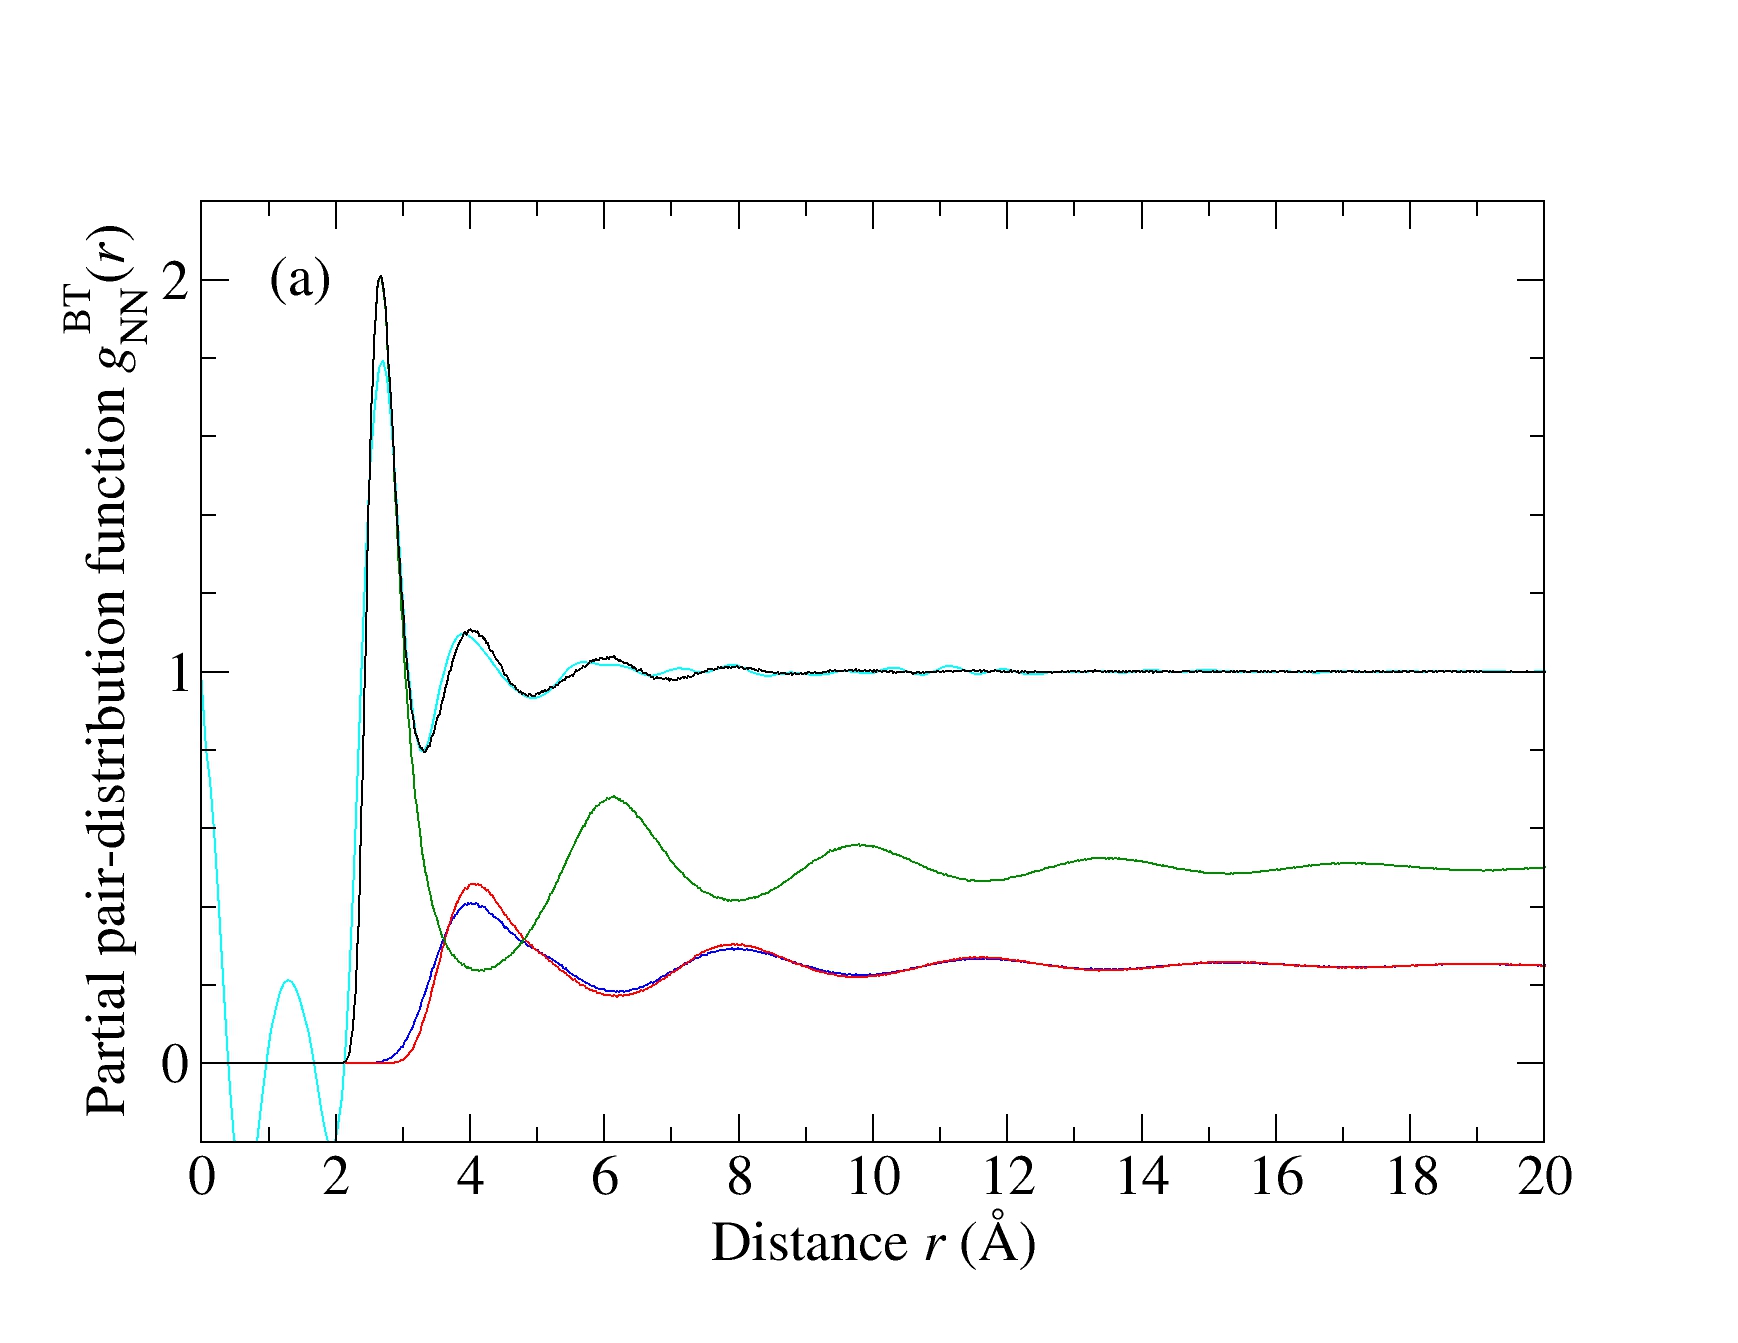
Figure 7a shows the Bhatia-Thornton partial pair-distribution function g^{BT}_{NN}(r) from the present diffraction work and from the PIM simulation. Also shown is the breakdown of the simulated function into its contributions from the weighted g_{NaCl}(r), g_{ClCl}(r) and g_{NaNa}(r) functions.
Fig7b_gcc_v3.jpg
image/jpeg (298kB)
Creative Commons: Attribution 4.0
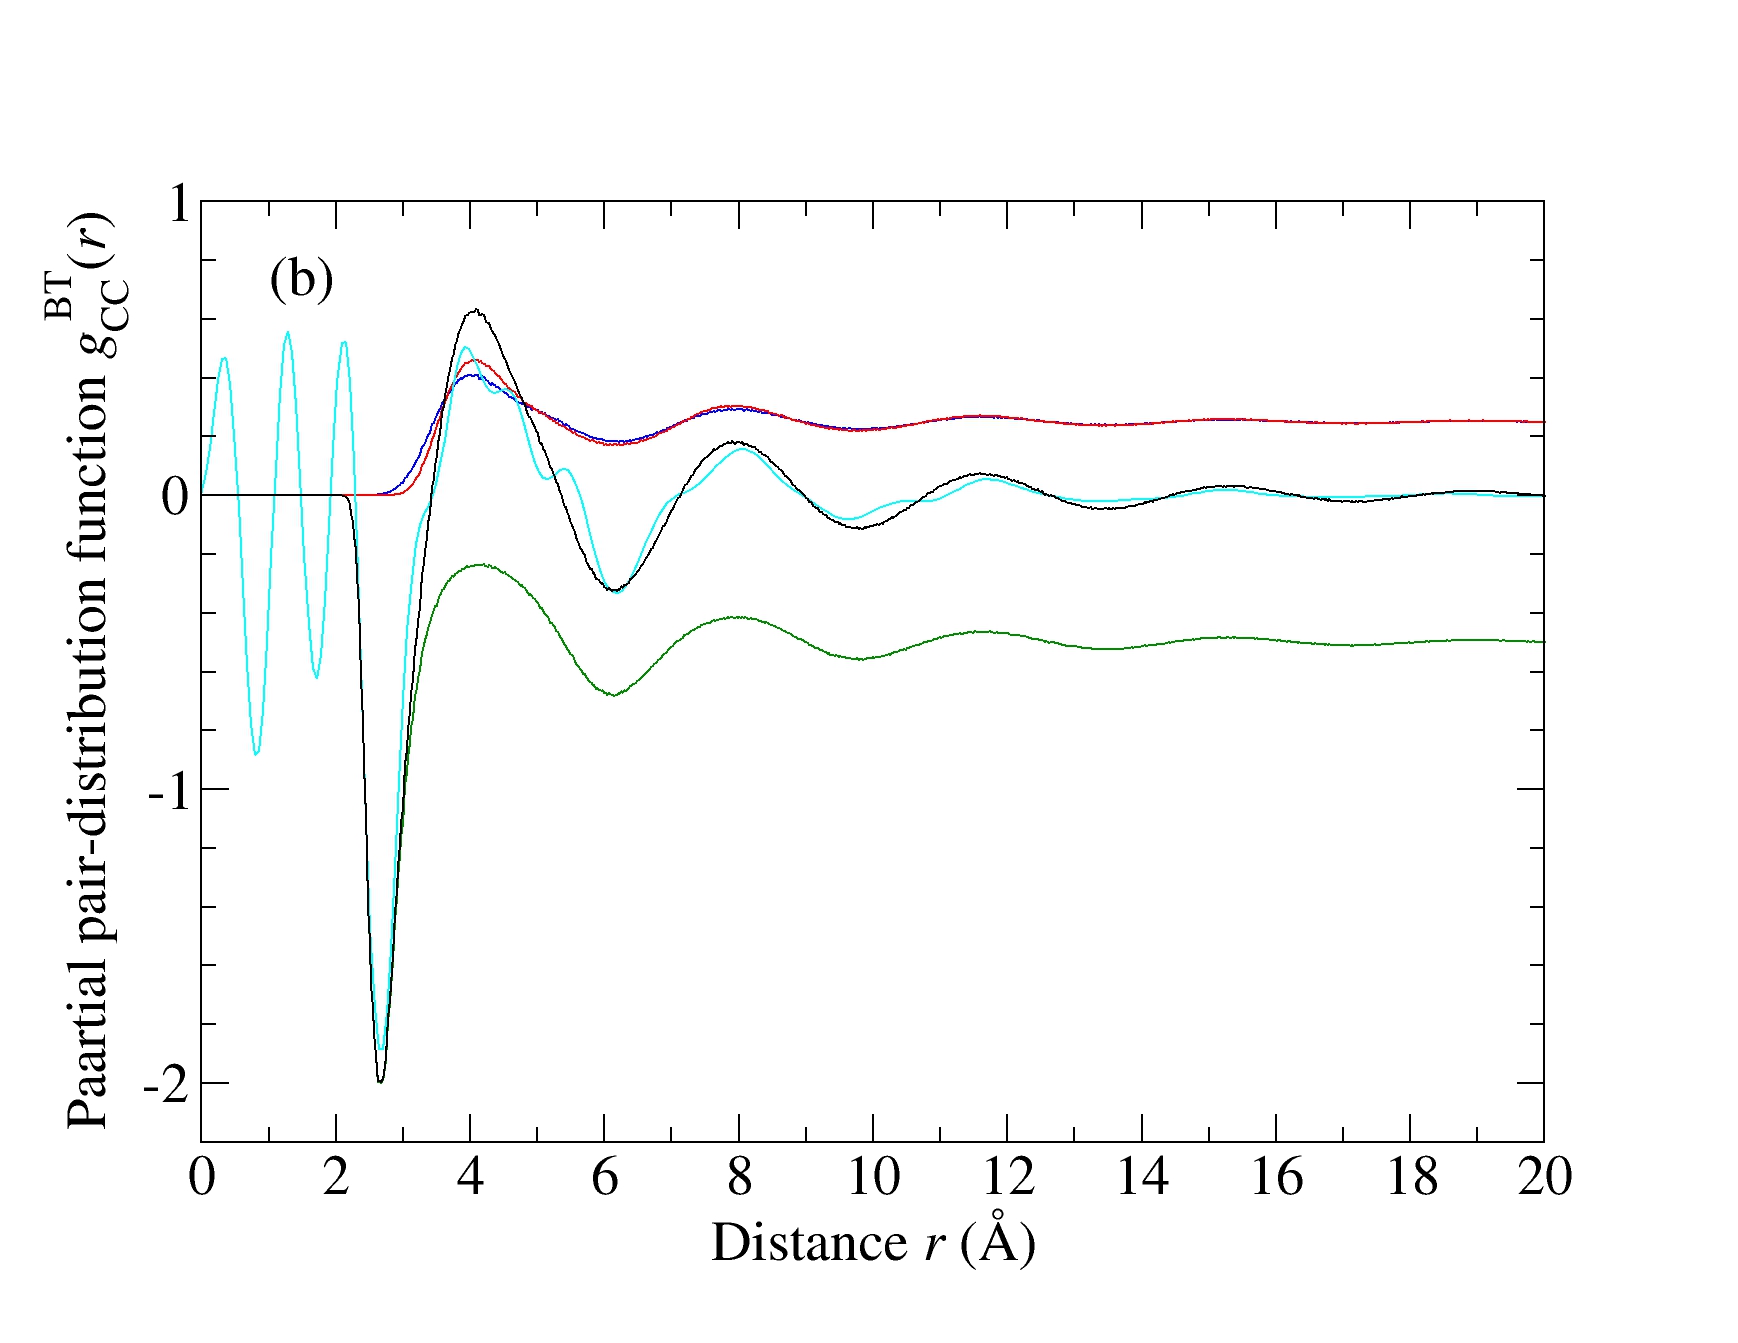
Figure 7b shows the Bhatia-Thornton partial pair-distribution function g^{BT}_{CC}(r) from the present diffraction work and from the PIM simulation. Also shown is the breakdown of the simulated function into its contributions from the weighted g_{NaCl}(r), g_{ClCl}(r) and g_{NaNa}(r) functions.
Fig7c_gnc_v3.jpg
image/jpeg (324kB)
Creative Commons: Attribution 4.0
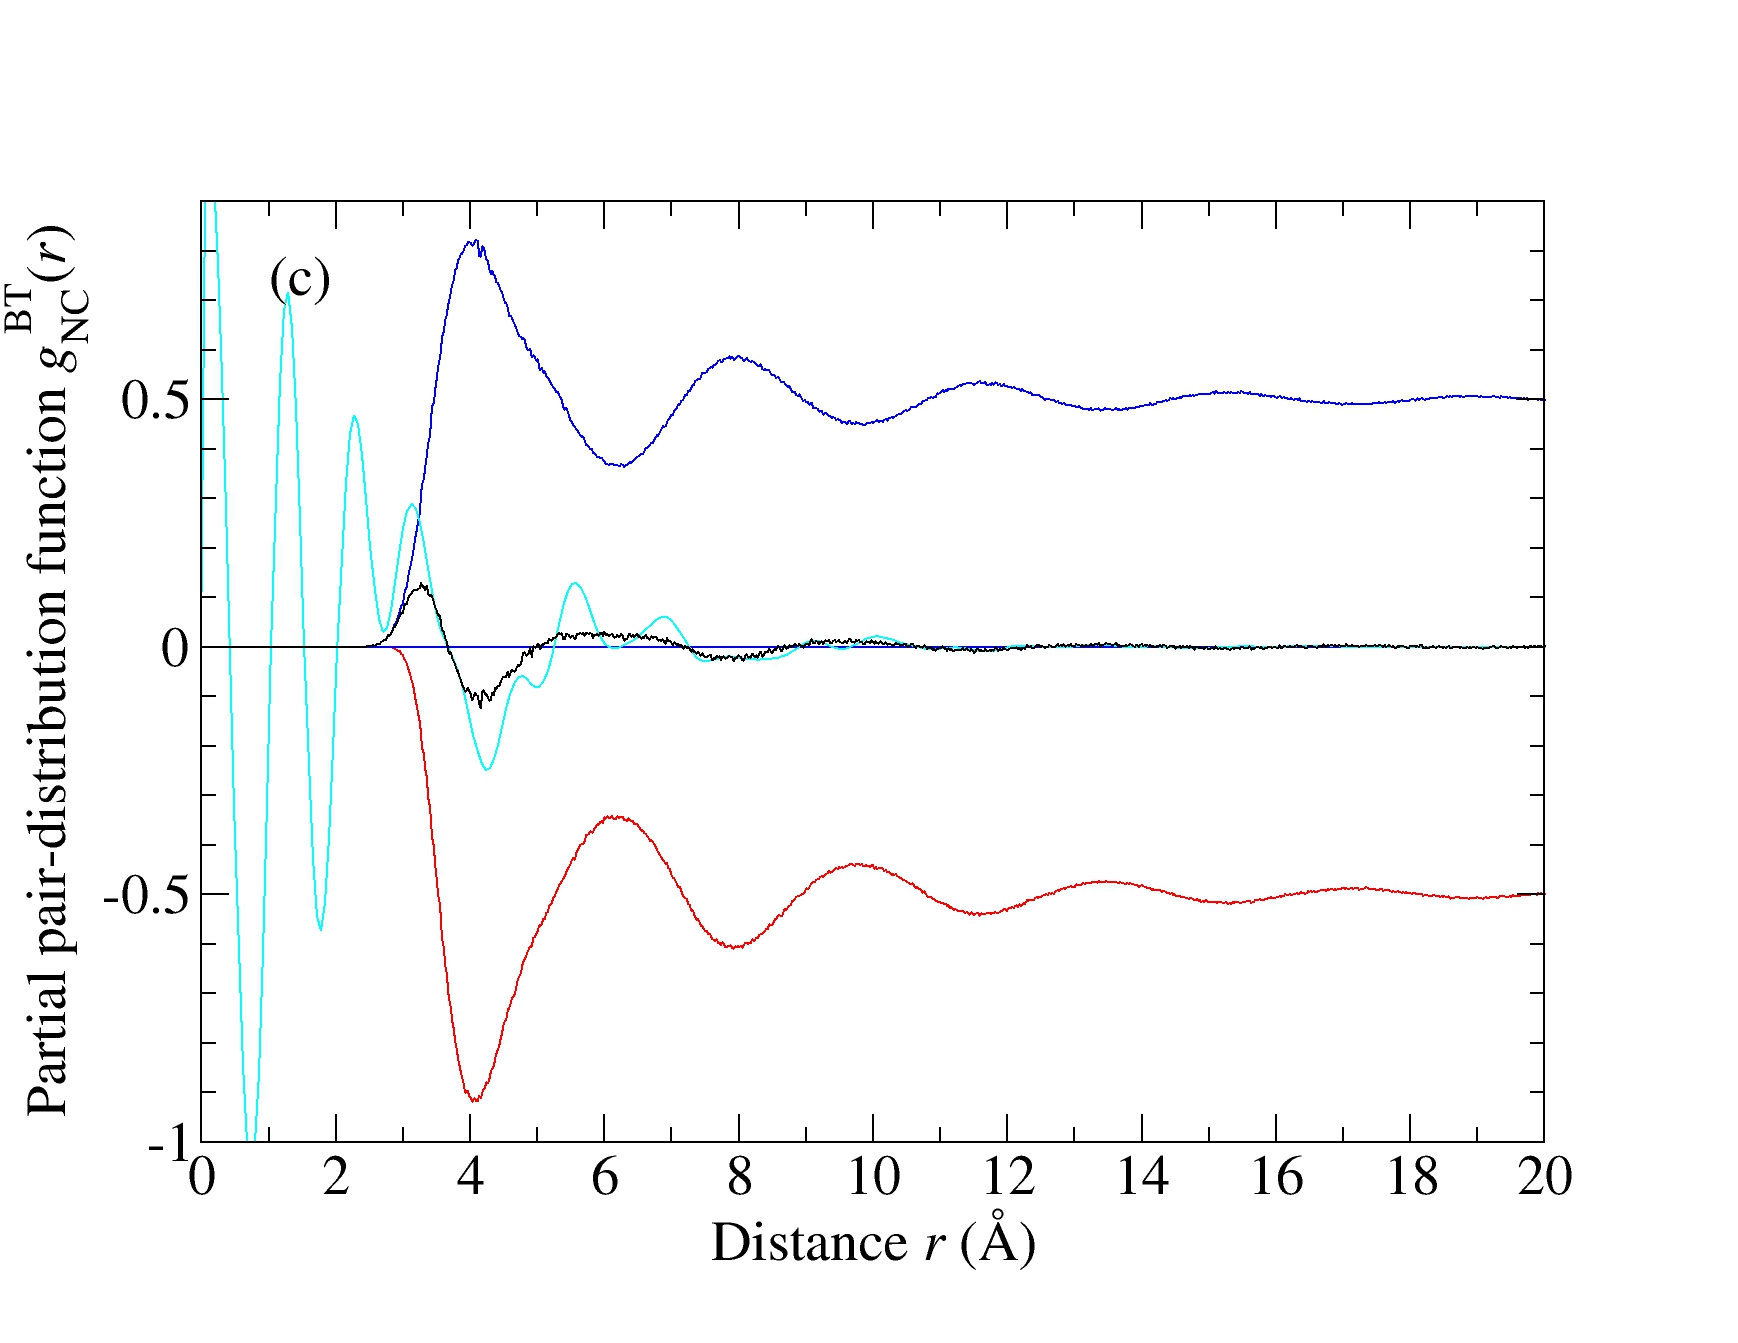
Figure 7c shows the Bhatia-Thornton partial pair-distribution function g^{BT}_{NC}(r) from the present diffraction work and from the PIM simulation. Also shown is the breakdown of the simulated function into its contributions from the weighted g_{NaCl}(r), g_{ClCl}(r) and g_{NaNa}(r) functions.
Coverage
Collection date(s):
From 7 May 2007 to 23 June 2022
Documentation
Data collection method:
The data sets were collected using the methods described in the published paper.
Data processing and preparation activities:
The data sets were analysed using the methods described in the published paper.
Technical details and requirements:
The figures were prepared using QtGrace (https://sourceforge.net/projects/qtgrace/). The data set corresponding to a plotted curve within an QtGrace file can be identified by clicking on that curve.
Additional information:
The files are labelled according to the corresponding figure numbers. The units for each axis are identified on the plots.
Methodology link:
Zeidler, A., Salmon, P. S., Usuki, T., Kohara, S., Fischer, H. E., and Wilson, M., 2022. Structure of molten NaCl and the decay of the pair-correlations. The Journal of Chemical Physics, 157(9), 094504. Available from: https://doi.org/10.1063/5.0107620.
Funders
Engineering and Physical Sciences Research Council
https://doi.org/10.13039/501100000266
Glassy and Liquid Networks: Deformability and Manipulation
EP/G008795/1
Japan Society for the Promotion of Science
https://doi.org/10.13039/501100001691
Grant
20H02430
Japan Society for the Promotion of Science
https://doi.org/10.13039/501100001691
Grant
16H03903
Publication details
Publication date: 26 August 2022
by: University of Bath
Version: 1
DOI: https://doi.org/10.15125/BATH-01165
URL for this record: https://researchdata.bath.ac.uk/1165
Related papers and books
Zeidler, A., Salmon, P. S., Usuki, T., Kohara, S., Fischer, H. E., and Wilson, M., 2022. Structure of molten NaCl and the decay of the pair-correlations. The Journal of Chemical Physics, 157(9), 094504. Available from: https://doi.org/10.1063/5.0107620.
Contact information
Please contact the Research Data Service in the first instance for all matters concerning this item.
Contact person: Philip Salmon
Faculty of Science
Physics
Research Centres & Institutes
Centre for Nanoscience and Nanotechnology
