Dataset for 'Design and fabrication of enhanced lateral growth for dislocation reduction and strain management in GaN using nanodashes'
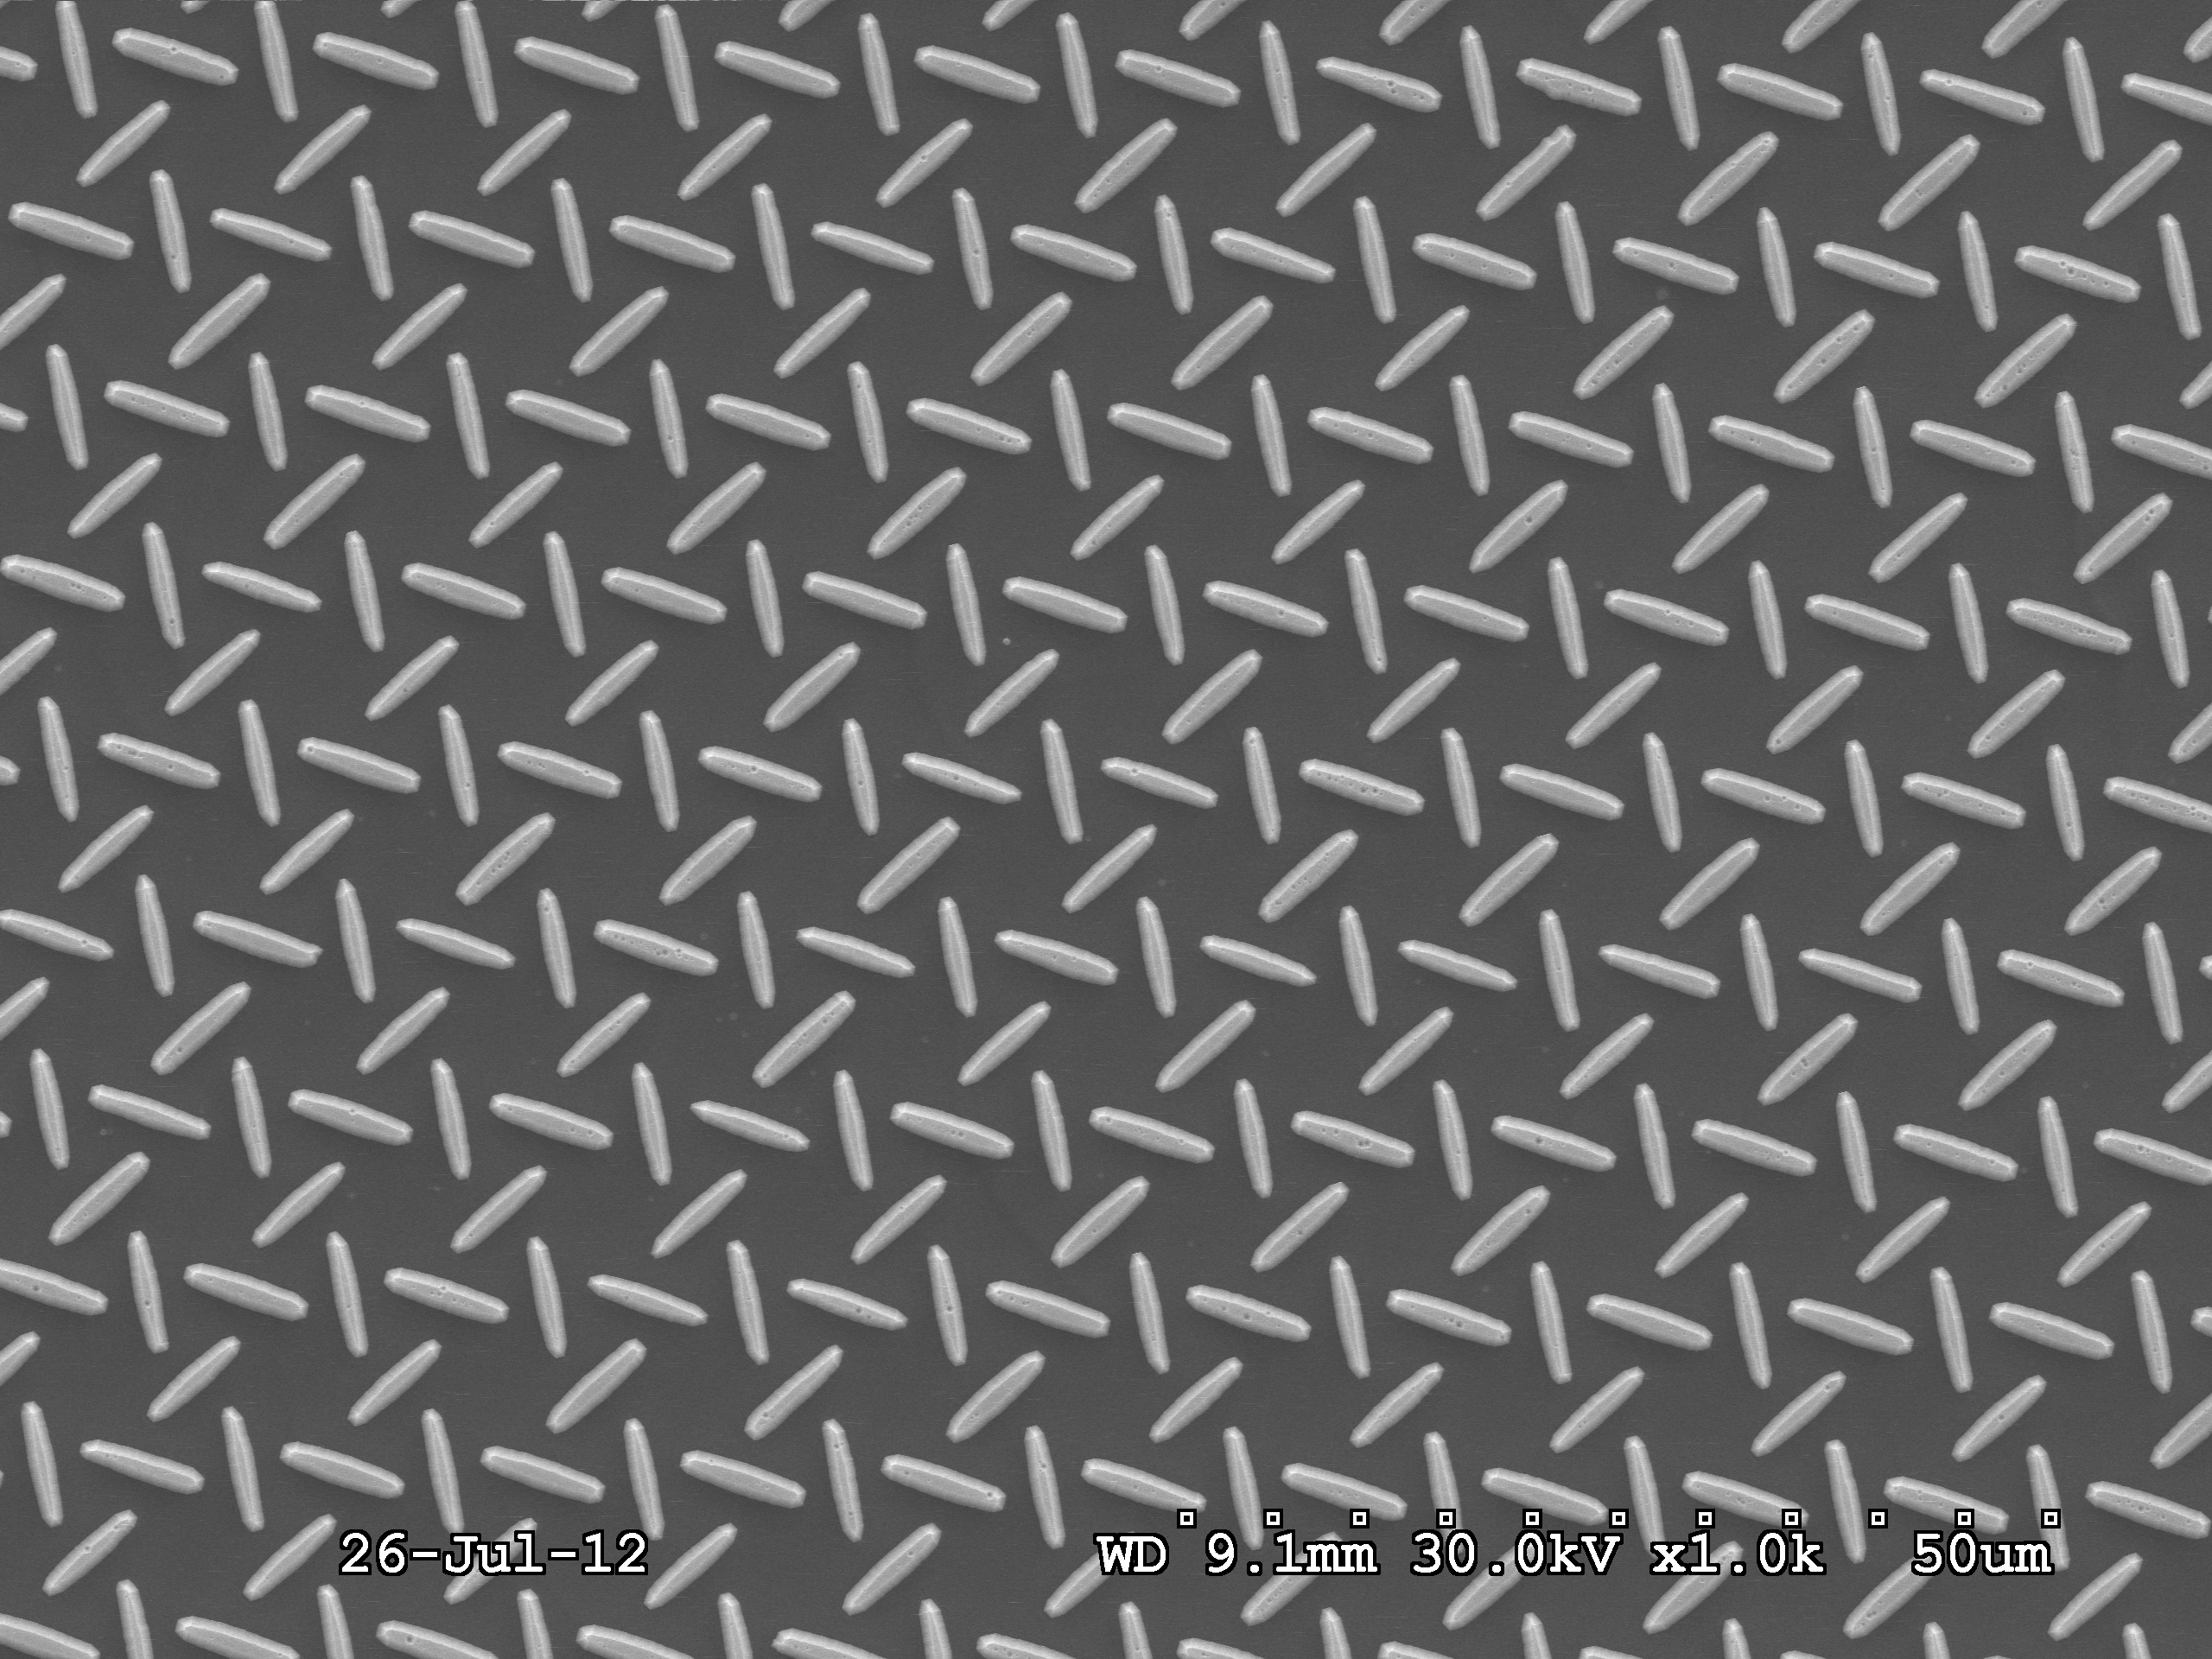
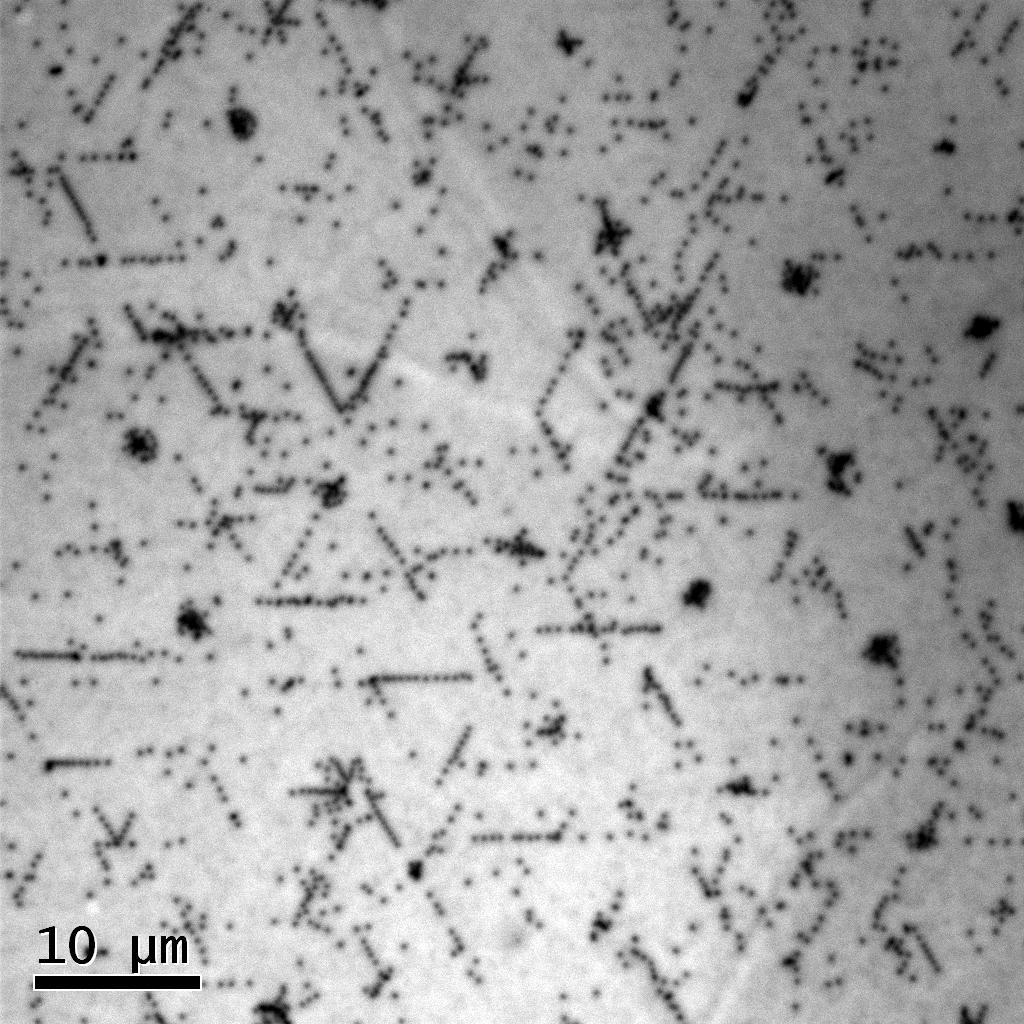
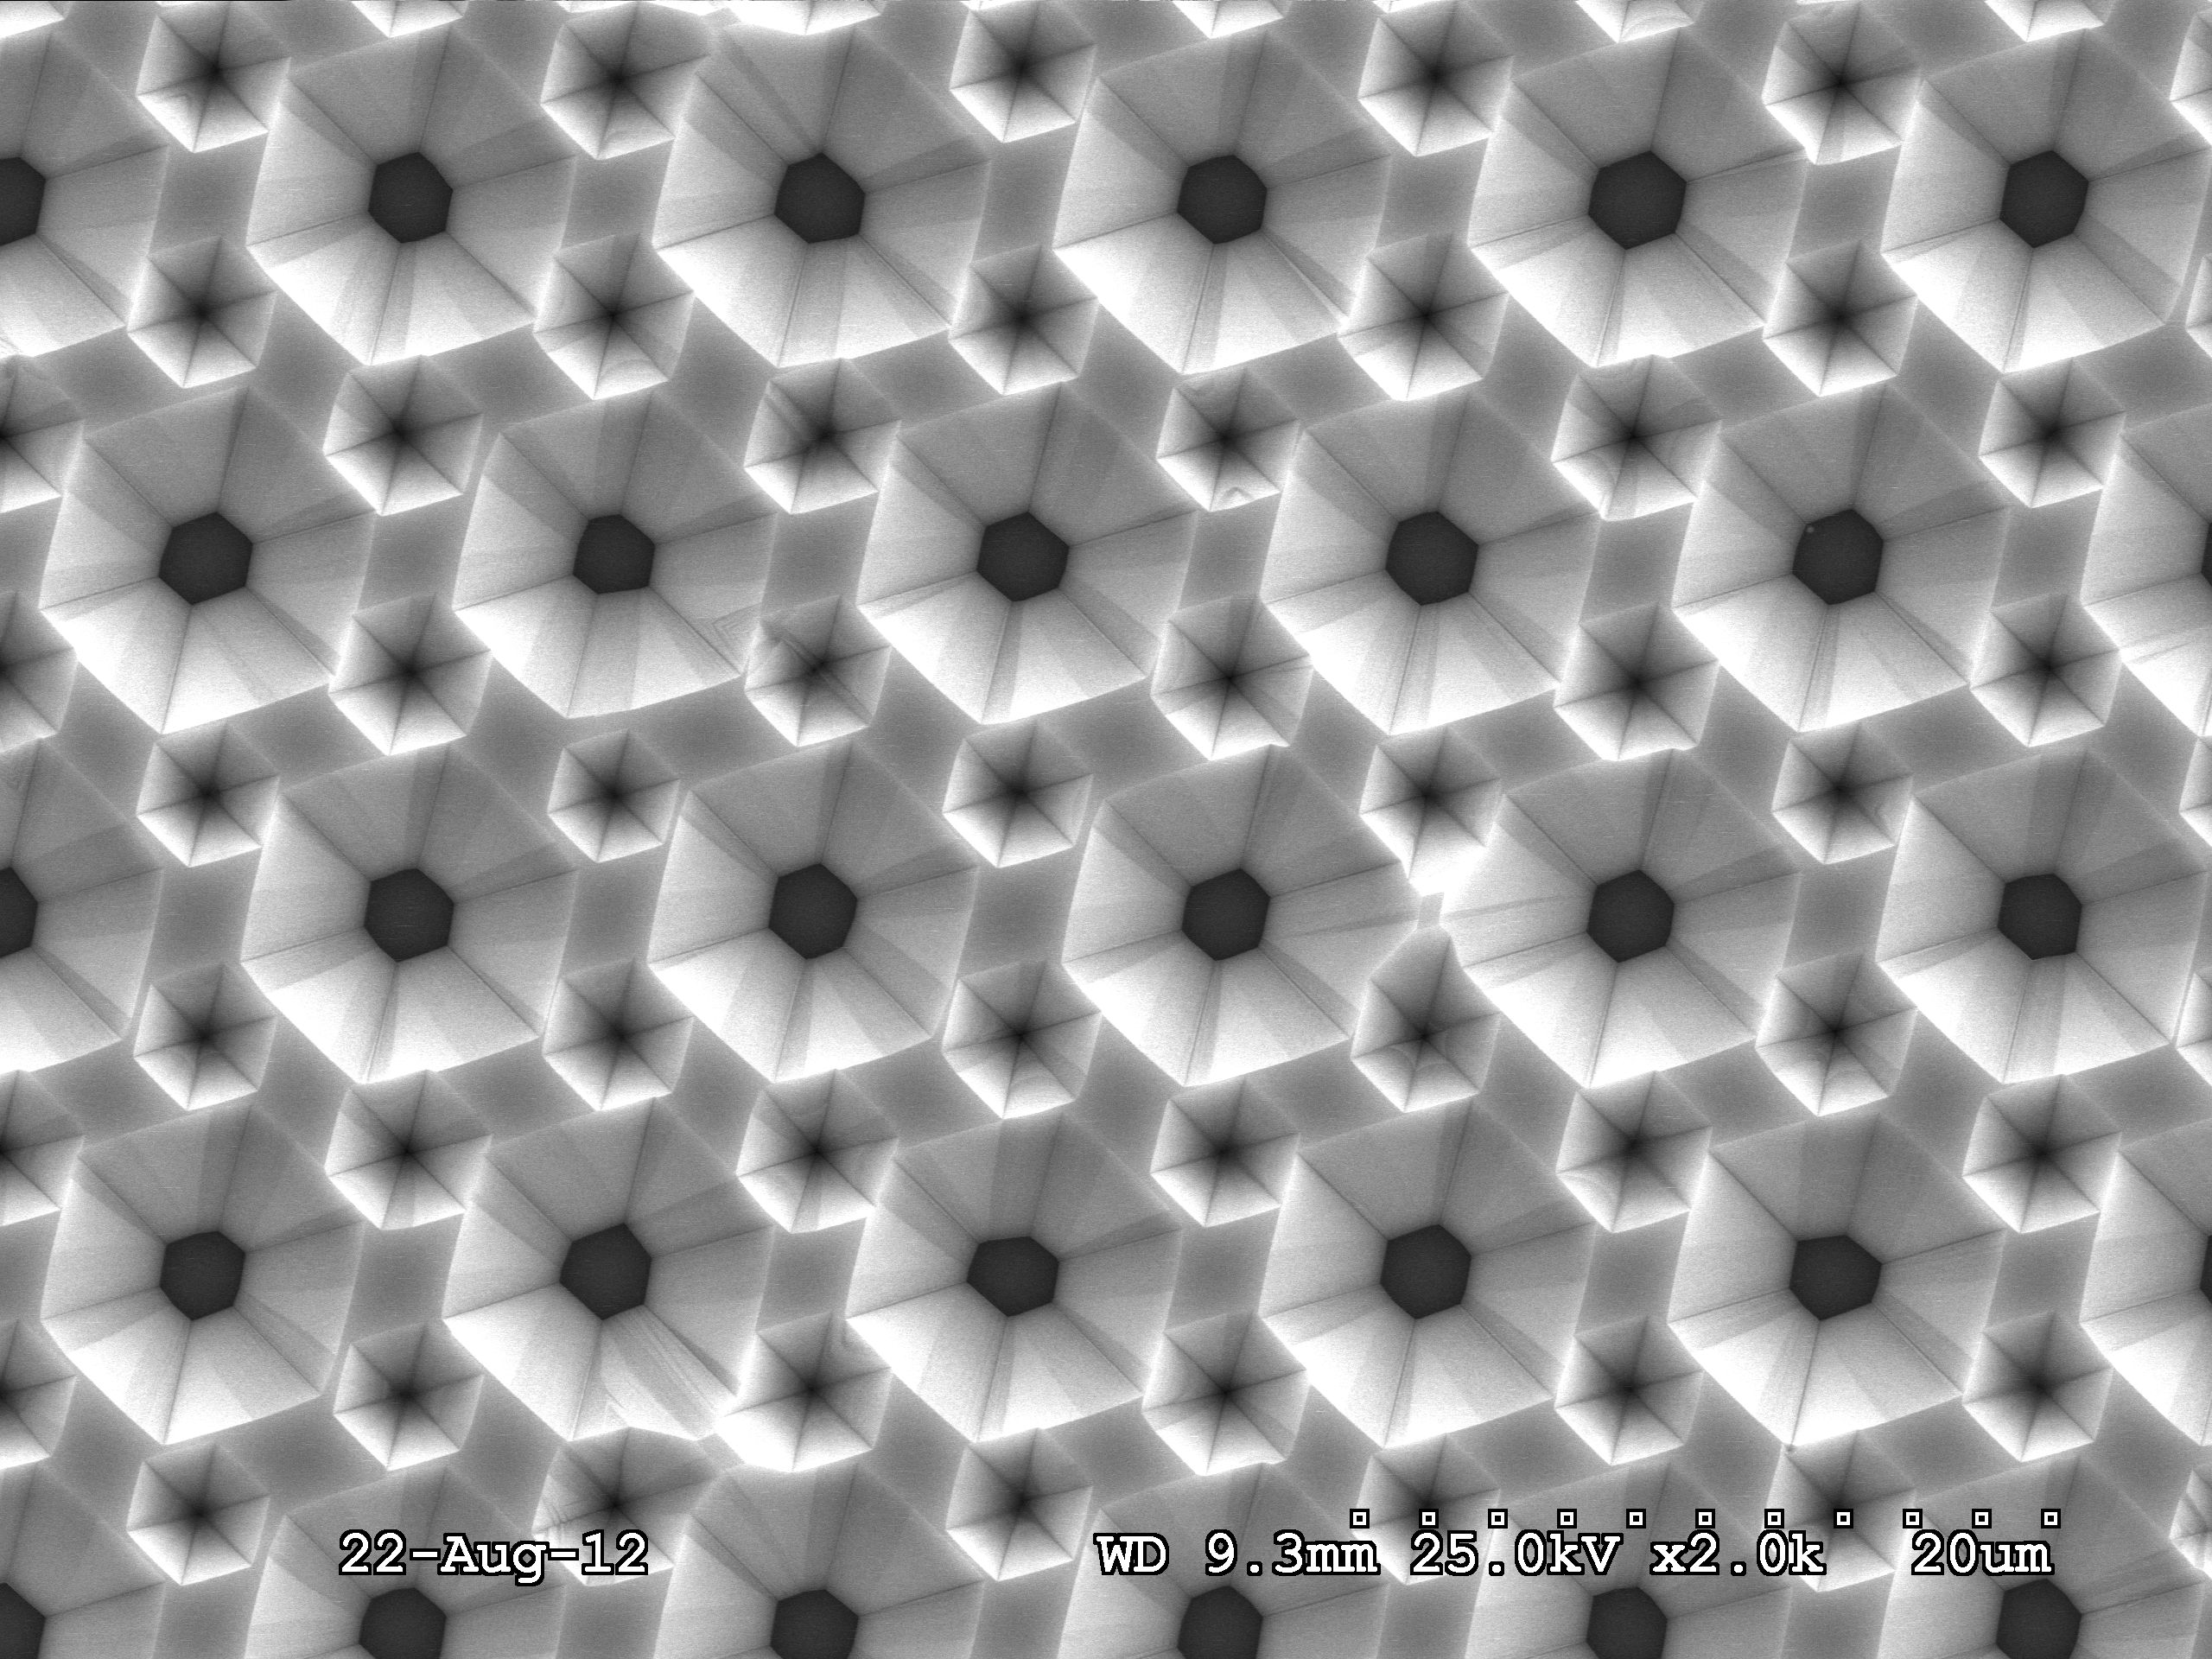
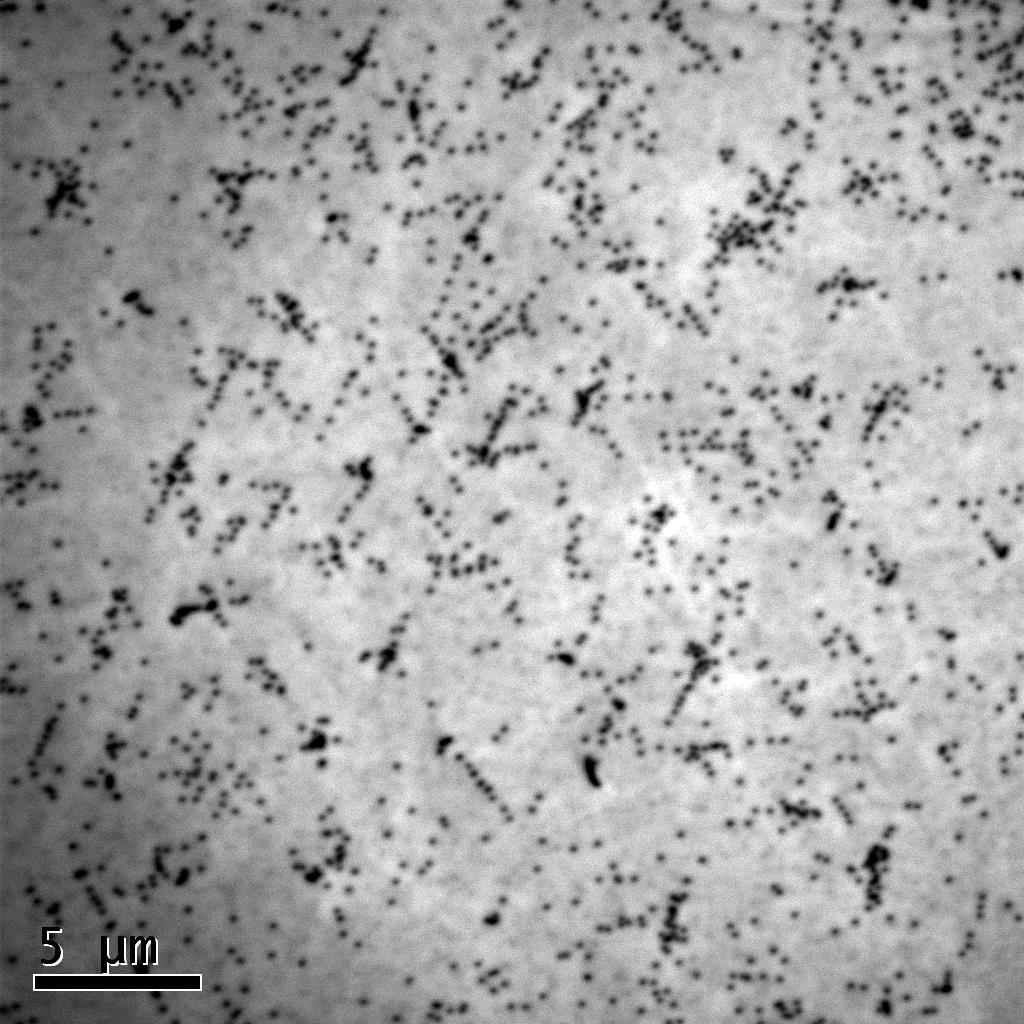
This dataset contains the results of scanning electron microscopy (SEM) secondary electron (SE) images, panchromatic cathodoluminescence (CL) imaging and Electron Channelling Contrast Imaging (ECCI) and Raman spectroscopy on GaN epitaxial layers. These techniques were used to assess the morphology of the GaN crystal growth, and the dislocation density and strain in planar layers.
Cite this dataset as:
Shields, P.,
Le Boulbar, E.,
Priesol, J.,
Šatka, A.,
Nouf-Allehiani, M.,
Naresh-Kumar, G.,
Fox, S.,
Trager-Cowan, C.,
2017.
Dataset for 'Design and fabrication of enhanced lateral growth for dislocation reduction and strain management in GaN using nanodashes'.
Bath: University of Bath Research Data Archive.
Available from: https://doi.org/10.15125/BATH-00257.
Export
Data
Fig_1ae_D0604 … x30k_anno.bmp
image/x-ms-bmp (308kB)
Creative Commons: Attribution 4.0
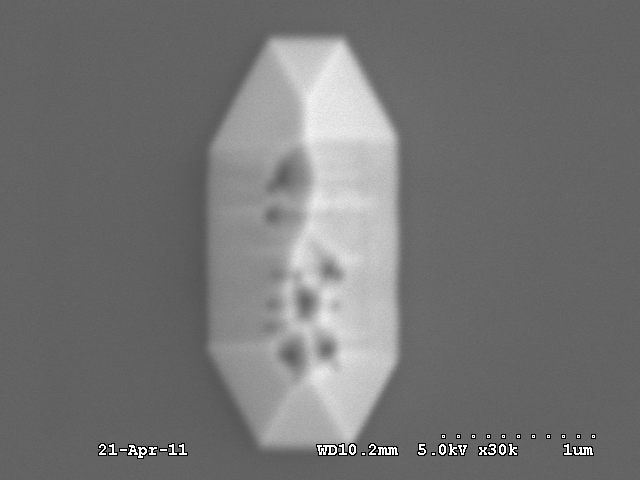
Secondary electron image of the growth window used in fig1a and 1e
Fig1b_2793_P3c1_x30k.bmp
image/x-ms-bmp (308kB)
Creative Commons: Attribution 4.0
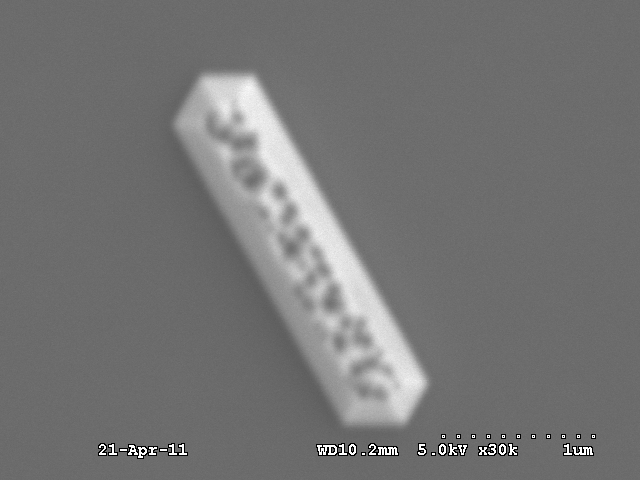
Secondary electron image of the growth used in fig1b
Fig1c_2794_P4c1_x30k.bmp
image/x-ms-bmp (308kB)
Creative Commons: Attribution 4.0
Secondary electron image of the growth used in fig1c
Fig1d_2795_P6c1_x30k.bmp
image/x-ms-bmp (308kB)
Creative Commons: Attribution 4.0
Secondary electron image of the growth used in fig1d
Fig1f_2793_P3c7_x30k.bmp
image/x-ms-bmp (308kB)
Creative Commons: Attribution 4.0
Secondary electron image of the growth used in fig1f
Fig1g_2794_P4c7_x30k.bmp
image/x-ms-bmp (308kB)
Creative Commons: Attribution 4.0
Secondary electron image of the growth used in fig1g
Fig1h_2795_P6c7_x30k.bmp
image/x-ms-bmp (308kB)
Creative Commons: Attribution 4.0
Secondary electron image of the growth used in fig1h
fig3a_pendeo … image_region_A.bmp
image/x-ms-bmp (1MB)
Creative Commons: Attribution 4.0
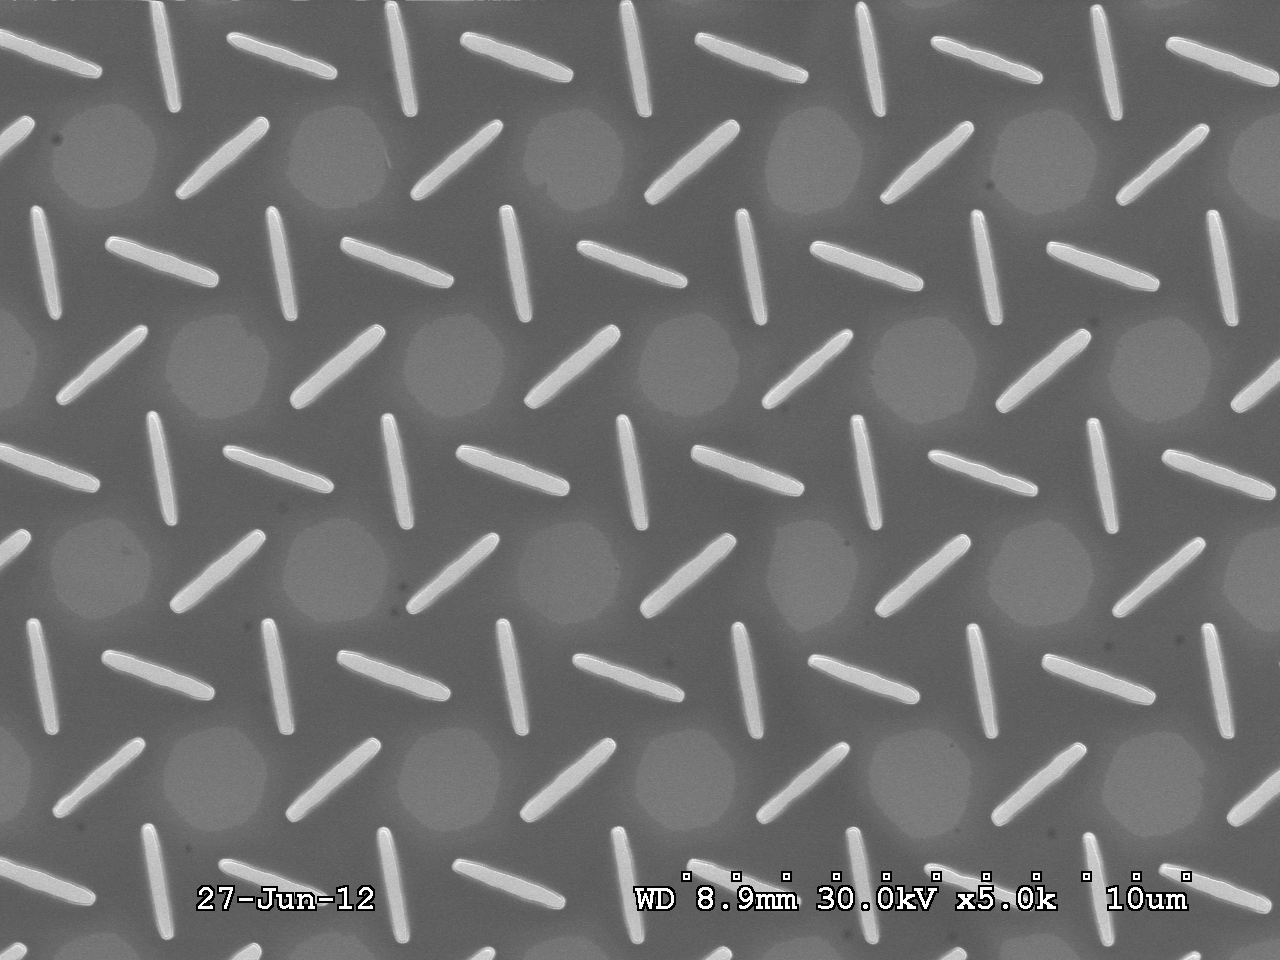
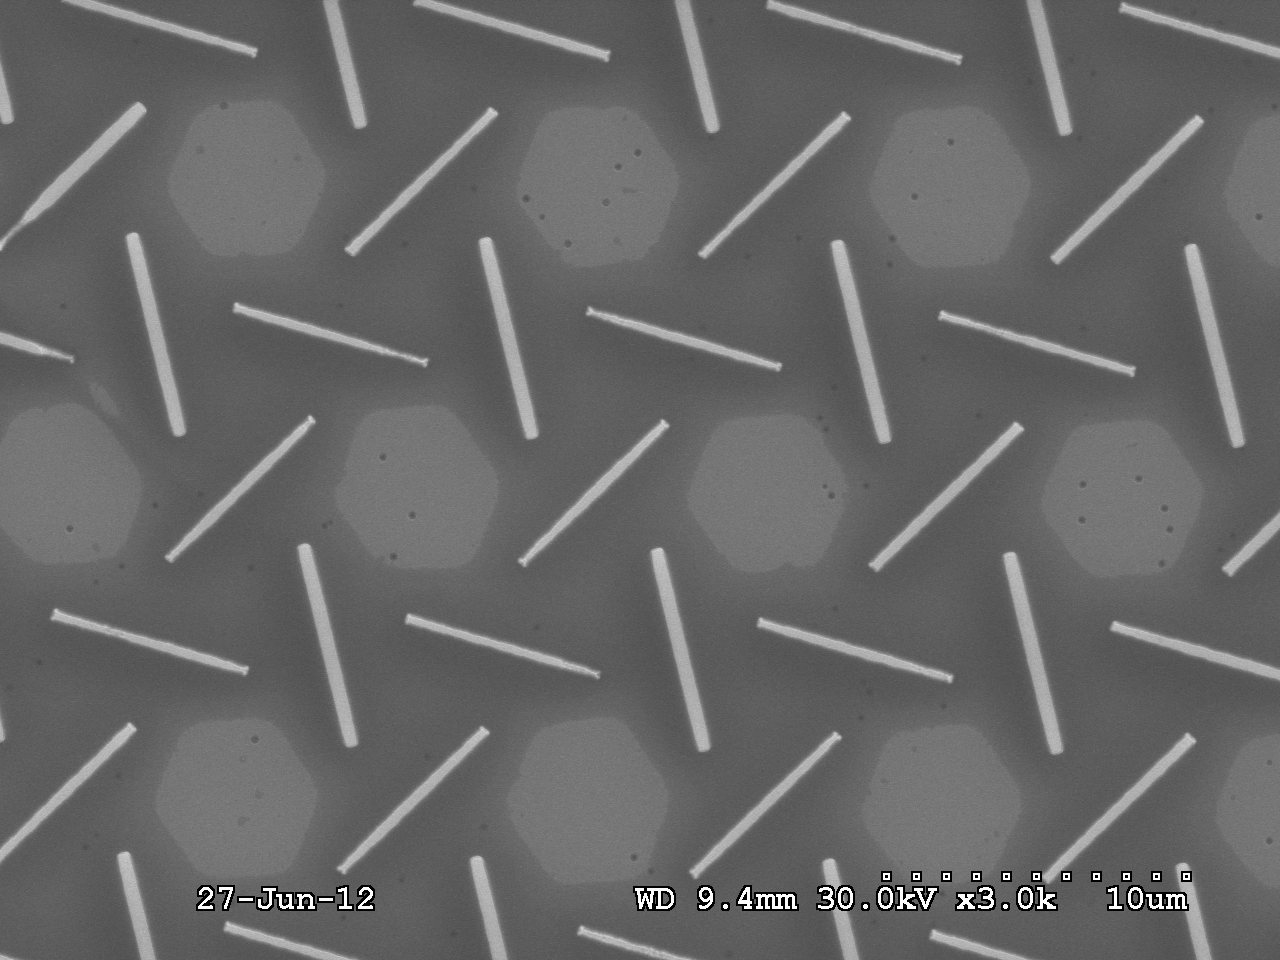
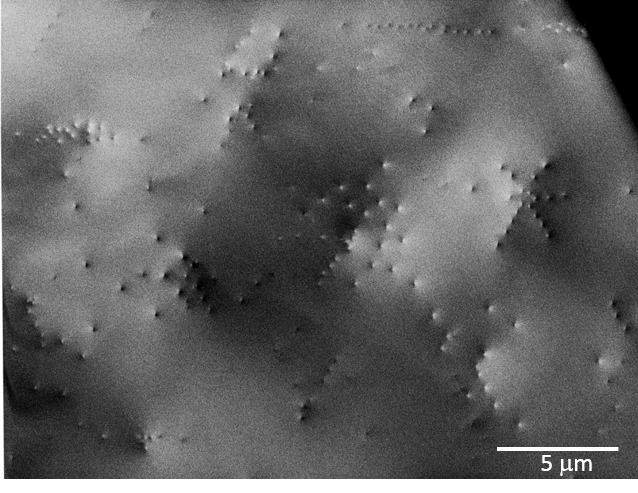
Secondary Electron Image of the pendeo template region A used for figure 3a
fig3b_pendeo … image_region_B.bmp
image/x-ms-bmp (4MB)
Creative Commons: Attribution 4.0
Secondary Electron Image of the pendeo template region B used for figure 3a
fig3c_pendeo … image_region_D.bmp
image/x-ms-bmp (1MB)
Creative Commons: Attribution 4.0
Secondary Electron Image of the pendeo template region D used for figure 3c
fig3d_ELOG … image_region_A.bmp
image/x-ms-bmp (1MB)
Creative Commons: Attribution 4.0
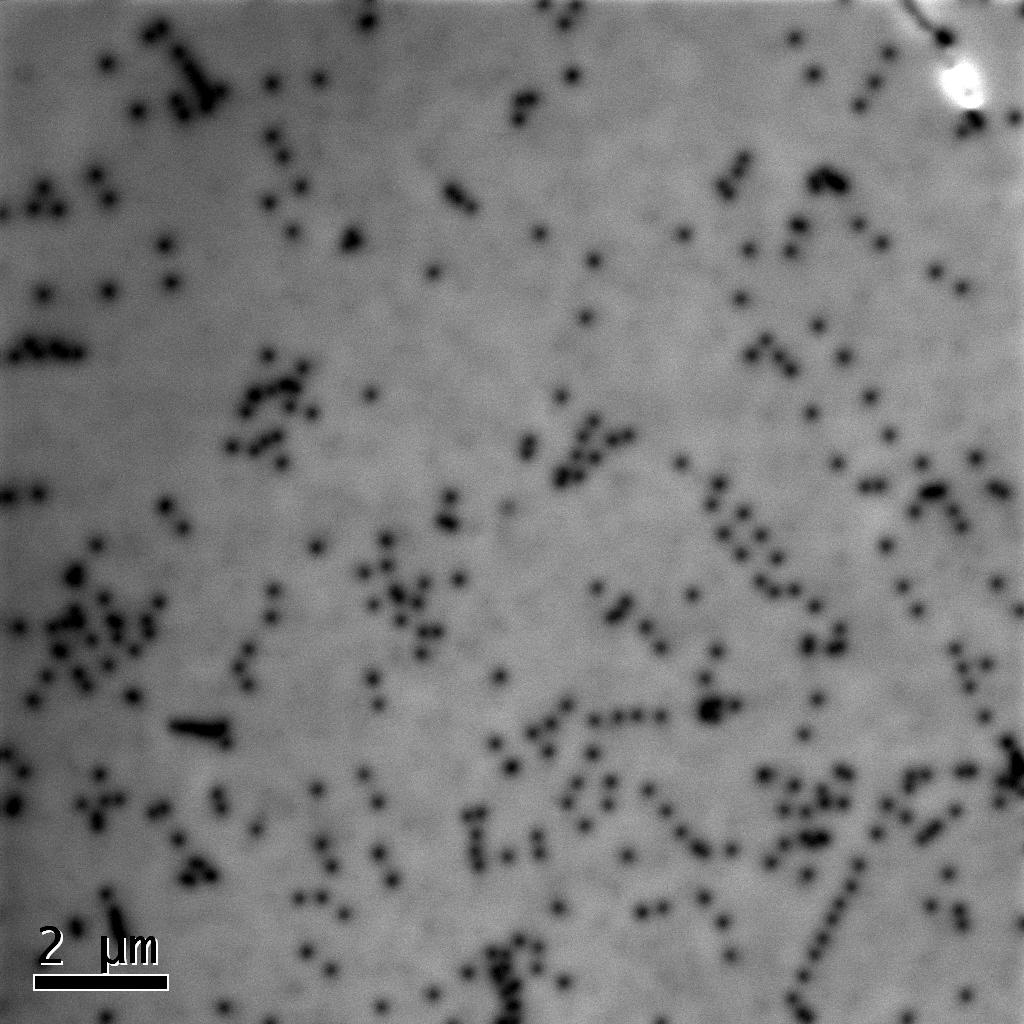
Secondary Electron Image of the ELOG template region A used for figure 3d
fig3e_ELOG … image_region_C.bmp
image/x-ms-bmp (1MB)
Creative Commons: Attribution 4.0
Secondary Electron Image of the ELOG template region C used for figure 3e
fig3f_ELOG … image_region_E.bmp
image/x-ms-bmp (4MB)
Creative Commons: Attribution 4.0
Secondary Electron Image of the ELOG template region E used for figure 3f
fig4a_ELOGtemplate_regionE.bmp
image/x-ms-bmp (4MB)
Creative Commons: Attribution 4.0
Secondary Electron Image of the ELOG template region E used for figure 4a
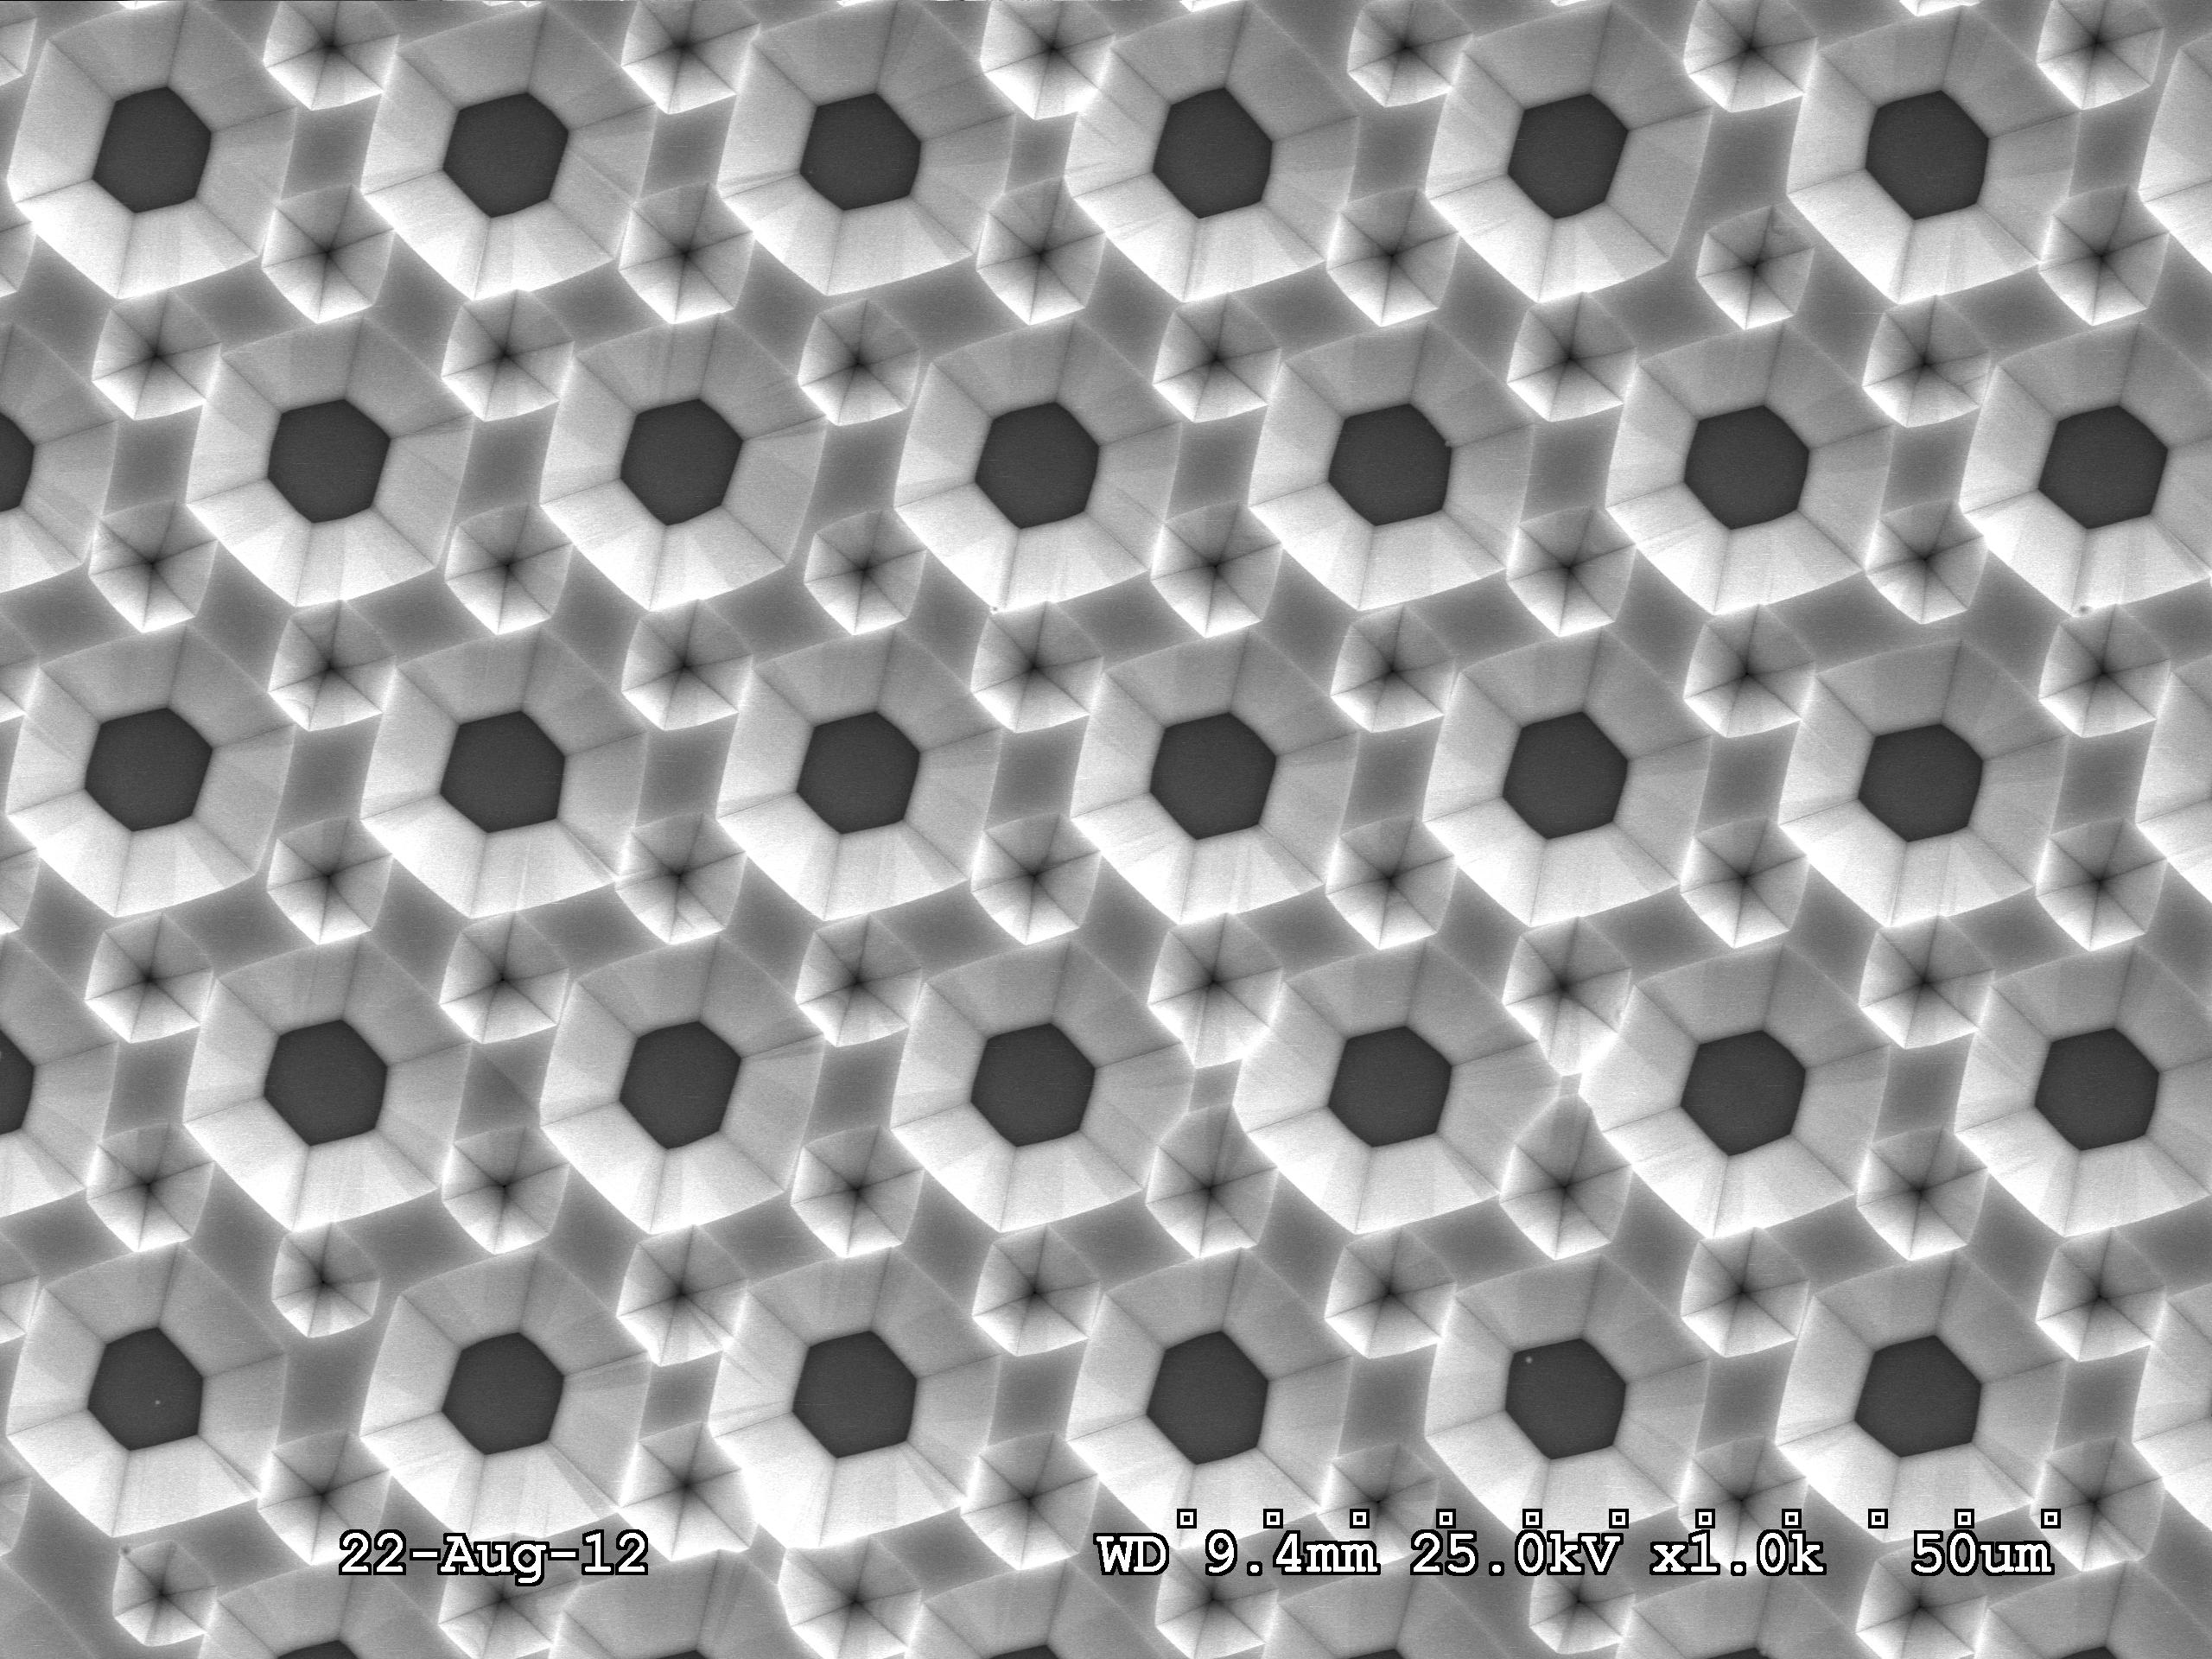
fig4b_GaNgrowth … step20min.bmp
image/x-ms-bmp (1MB)
Creative Commons: Attribution 4.0
Secondary Electron Image of the GaN growth (20min) obtained on the ELOG template region E used for figure 4b
fig4c_GaNgrowth … step20min.bmp
image/x-ms-bmp (4MB)
Creative Commons: Attribution 4.0
Secondary Electron Image of the GaN growth (20min) obtained on the ELOG template region E used for figure 4c
fig4d_GaNgrowth … step40min.bmp
image/x-ms-bmp (1MB)
Creative Commons: Attribution 4.0
Secondary Electron Image of the GaN growth (40min) obtained on the ELOG template region E used for figure 4e
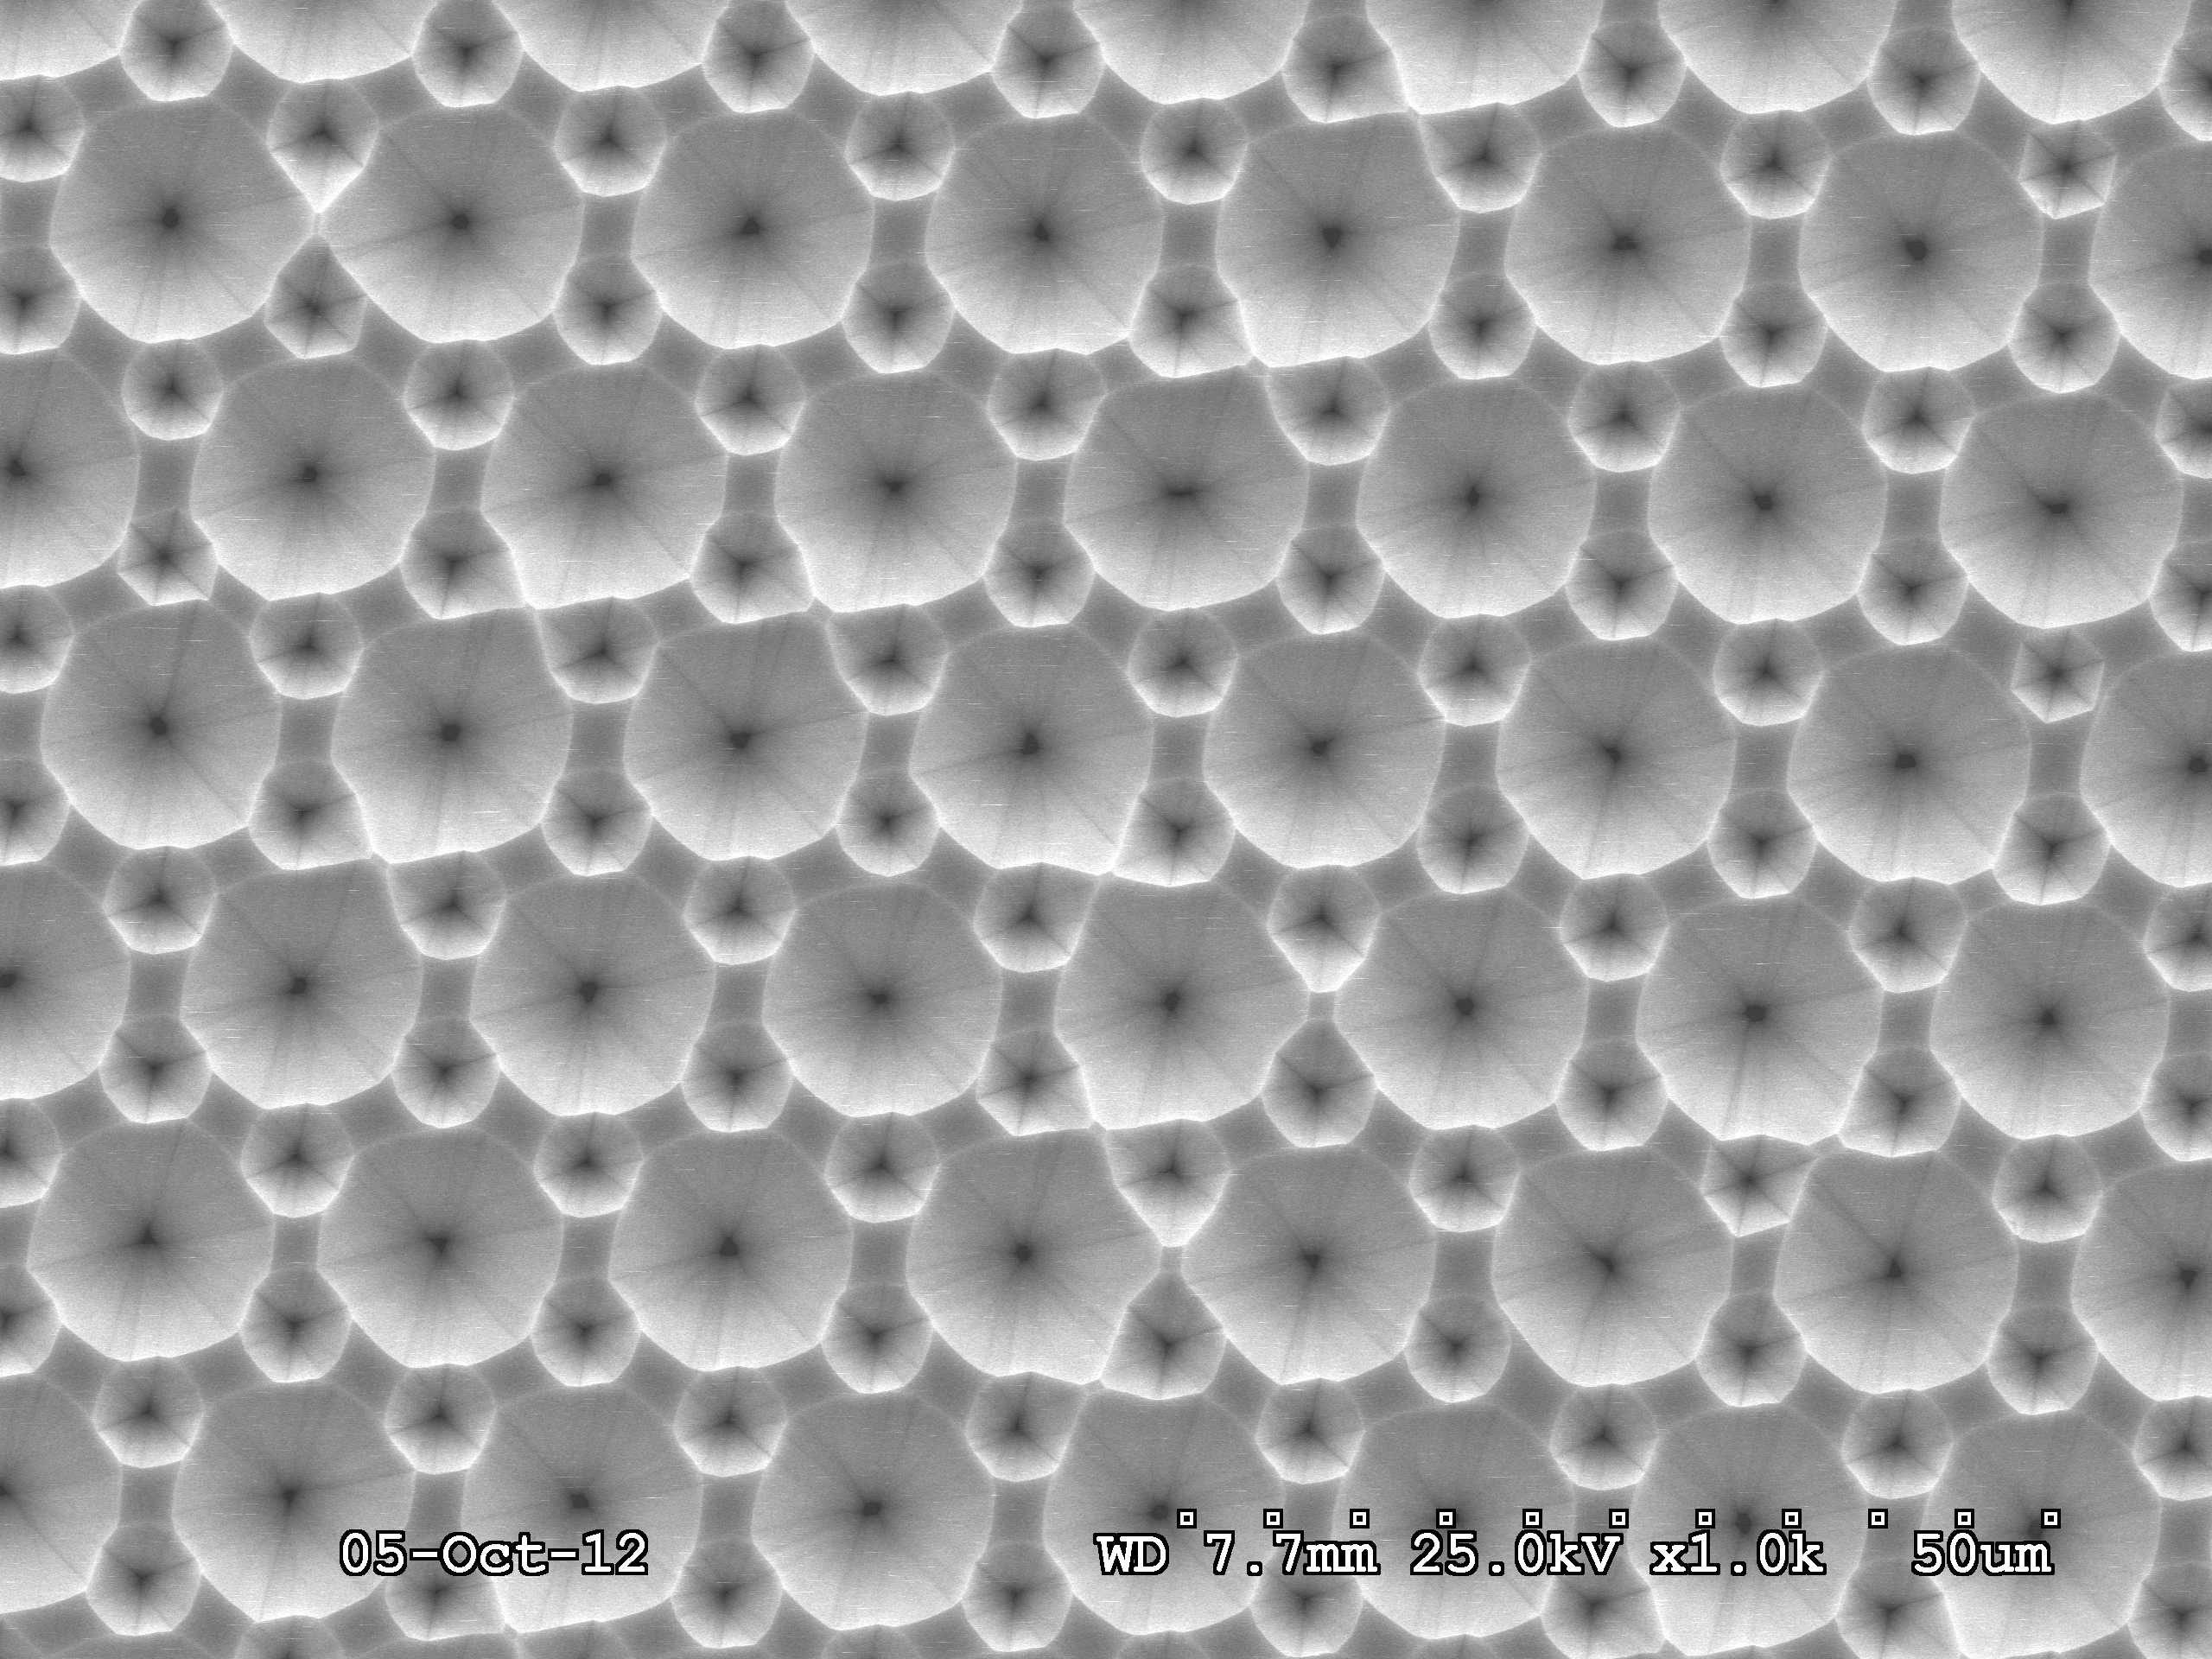
fig4e_GaNgrowth … 200min.bmp
image/x-ms-bmp (4MB)
Creative Commons: Attribution 4.0
Secondary Electron Image of the GaN growth (200min) obtained on the ELOG template region E used for figure 4e
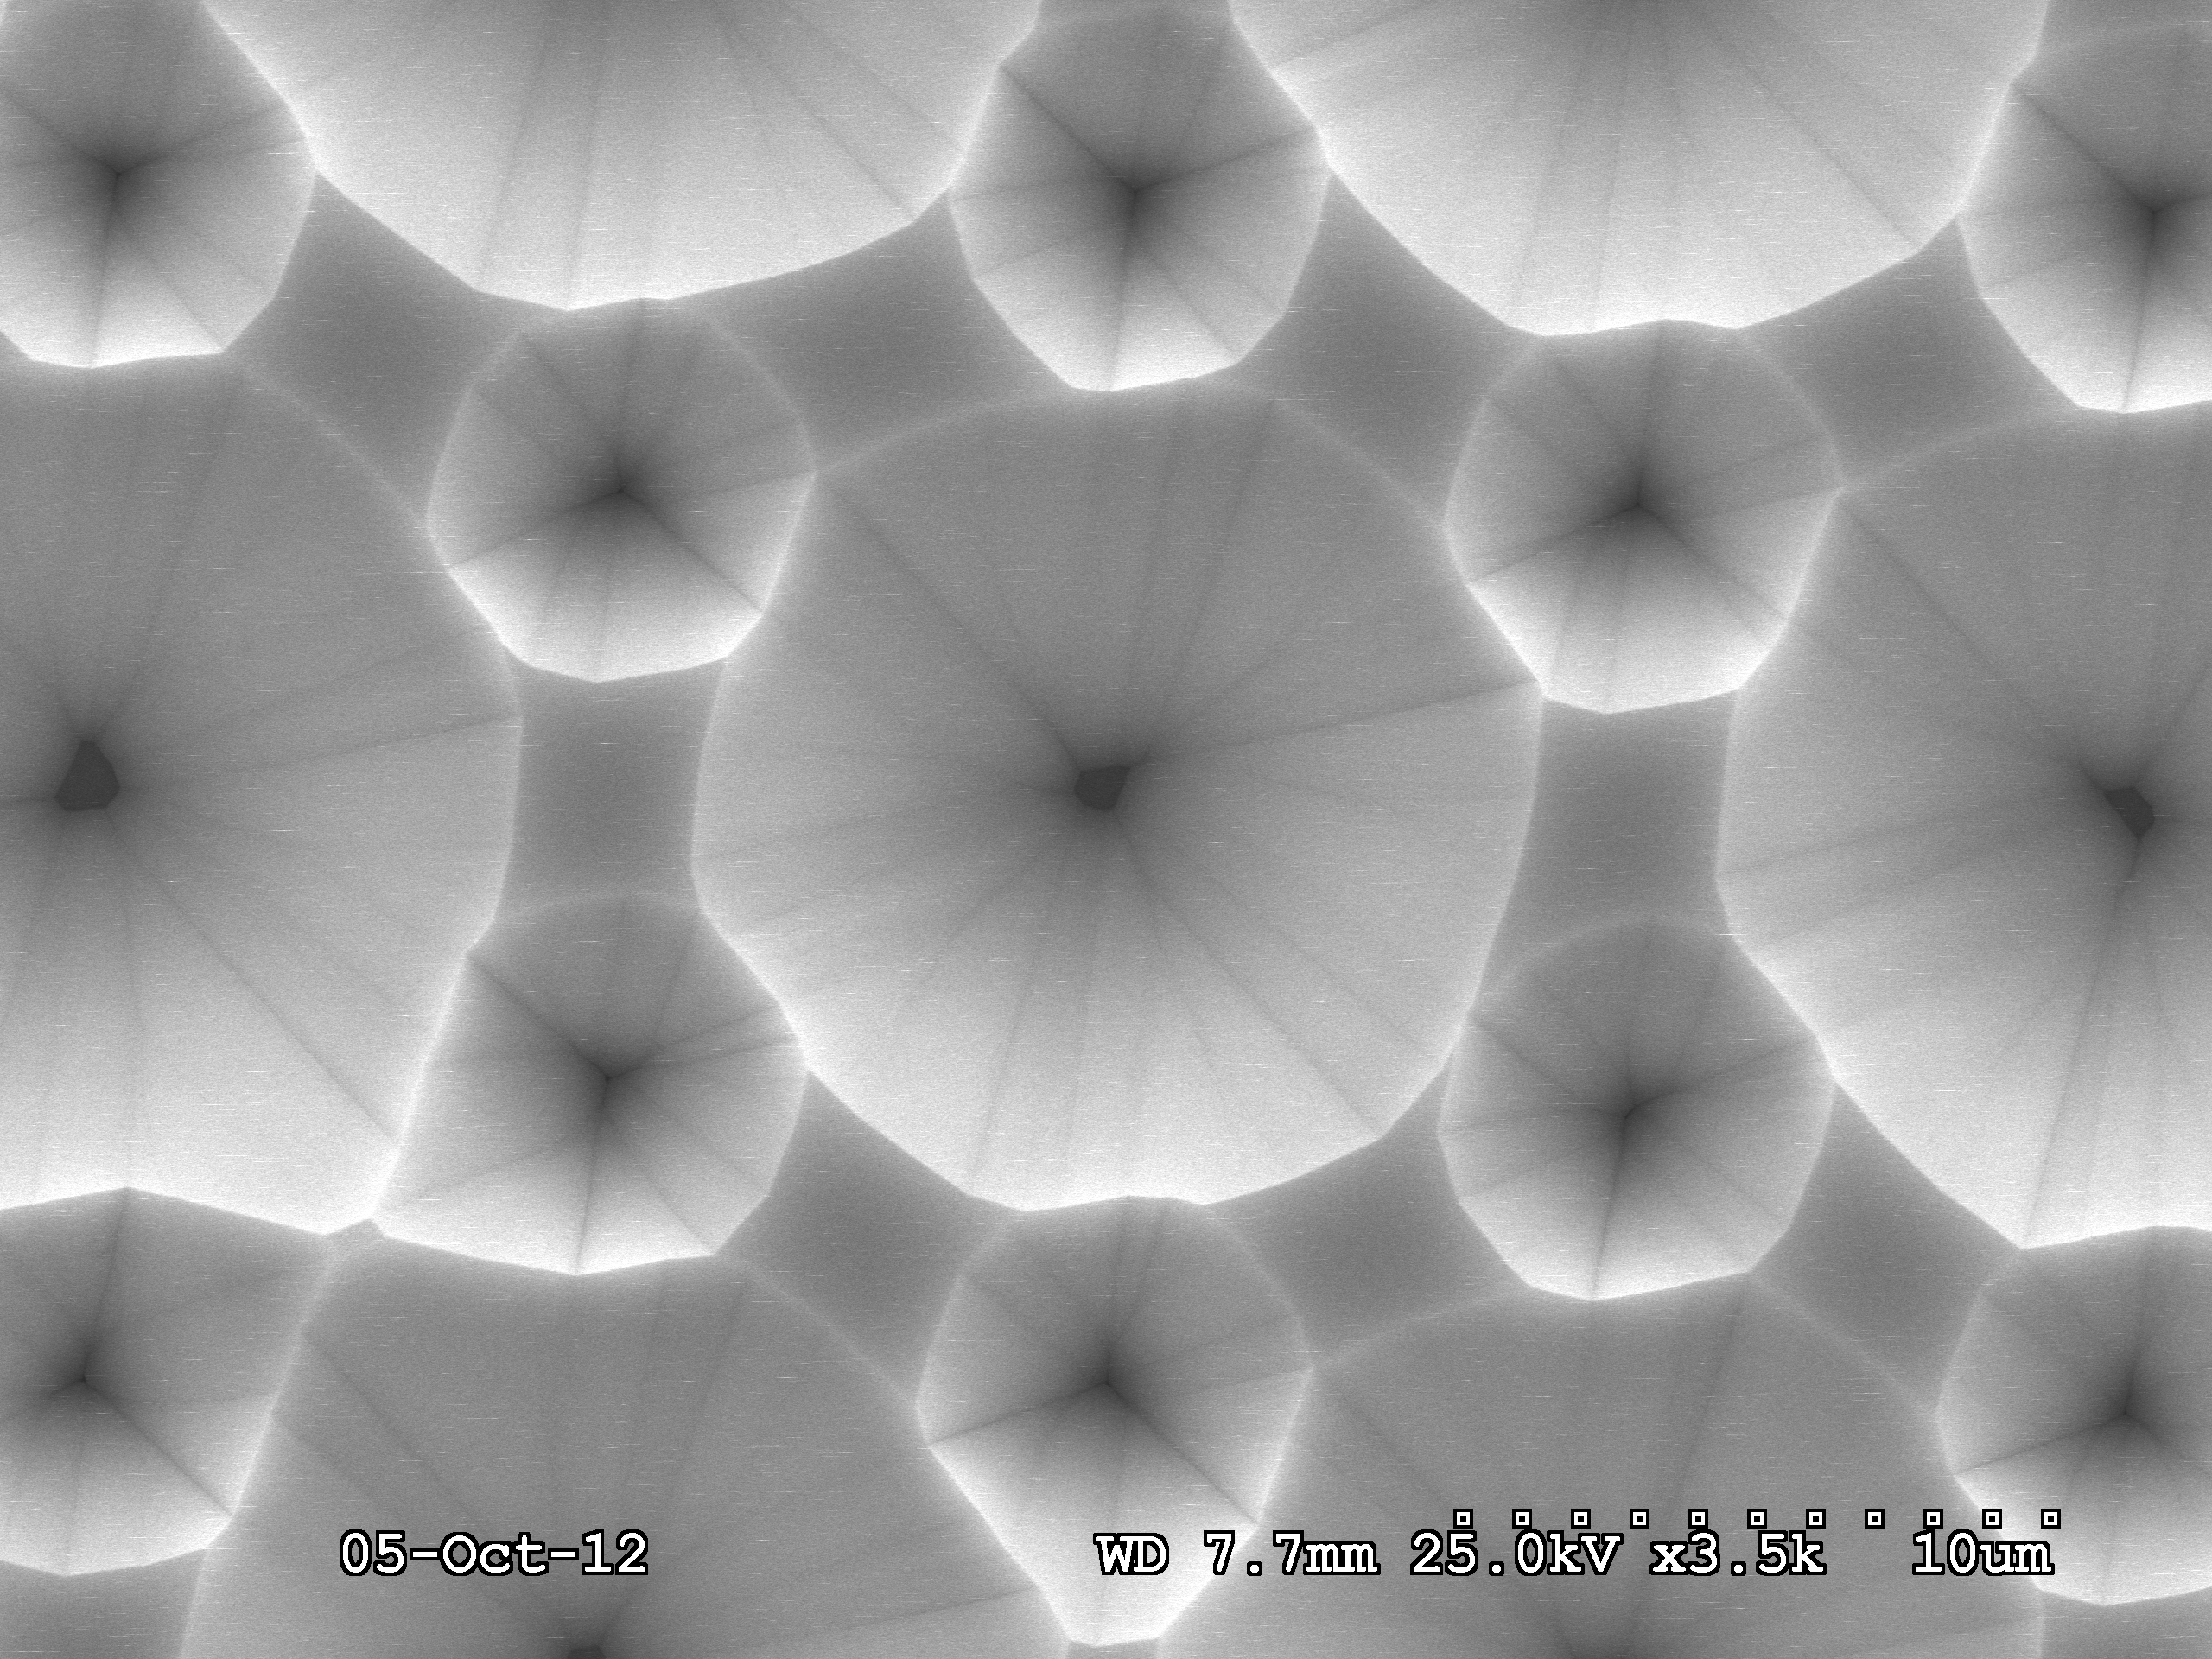
fig4f_GaNgrowth … 440min.bmp
image/x-ms-bmp (4MB)
Creative Commons: Attribution 4.0
Secondary Electron Image of the GaN growth (440min) obtained on the ELOG template region E used for figure 4f
fig4g_GaNgrowth … step560min.bmp
image/x-ms-bmp (4MB)
Creative Commons: Attribution 4.0
Secondary Electron Image of the GaN growth (560min) obtained on the ELOG template region E used for figure 4g
fig4h_GaNgrowth … step560min.bmp
image/x-ms-bmp (4MB)
Creative Commons: Attribution 4.0
Secondary Electron Image of the GaN growth (560min) obtained on the ELOG template region E used for figure 4h
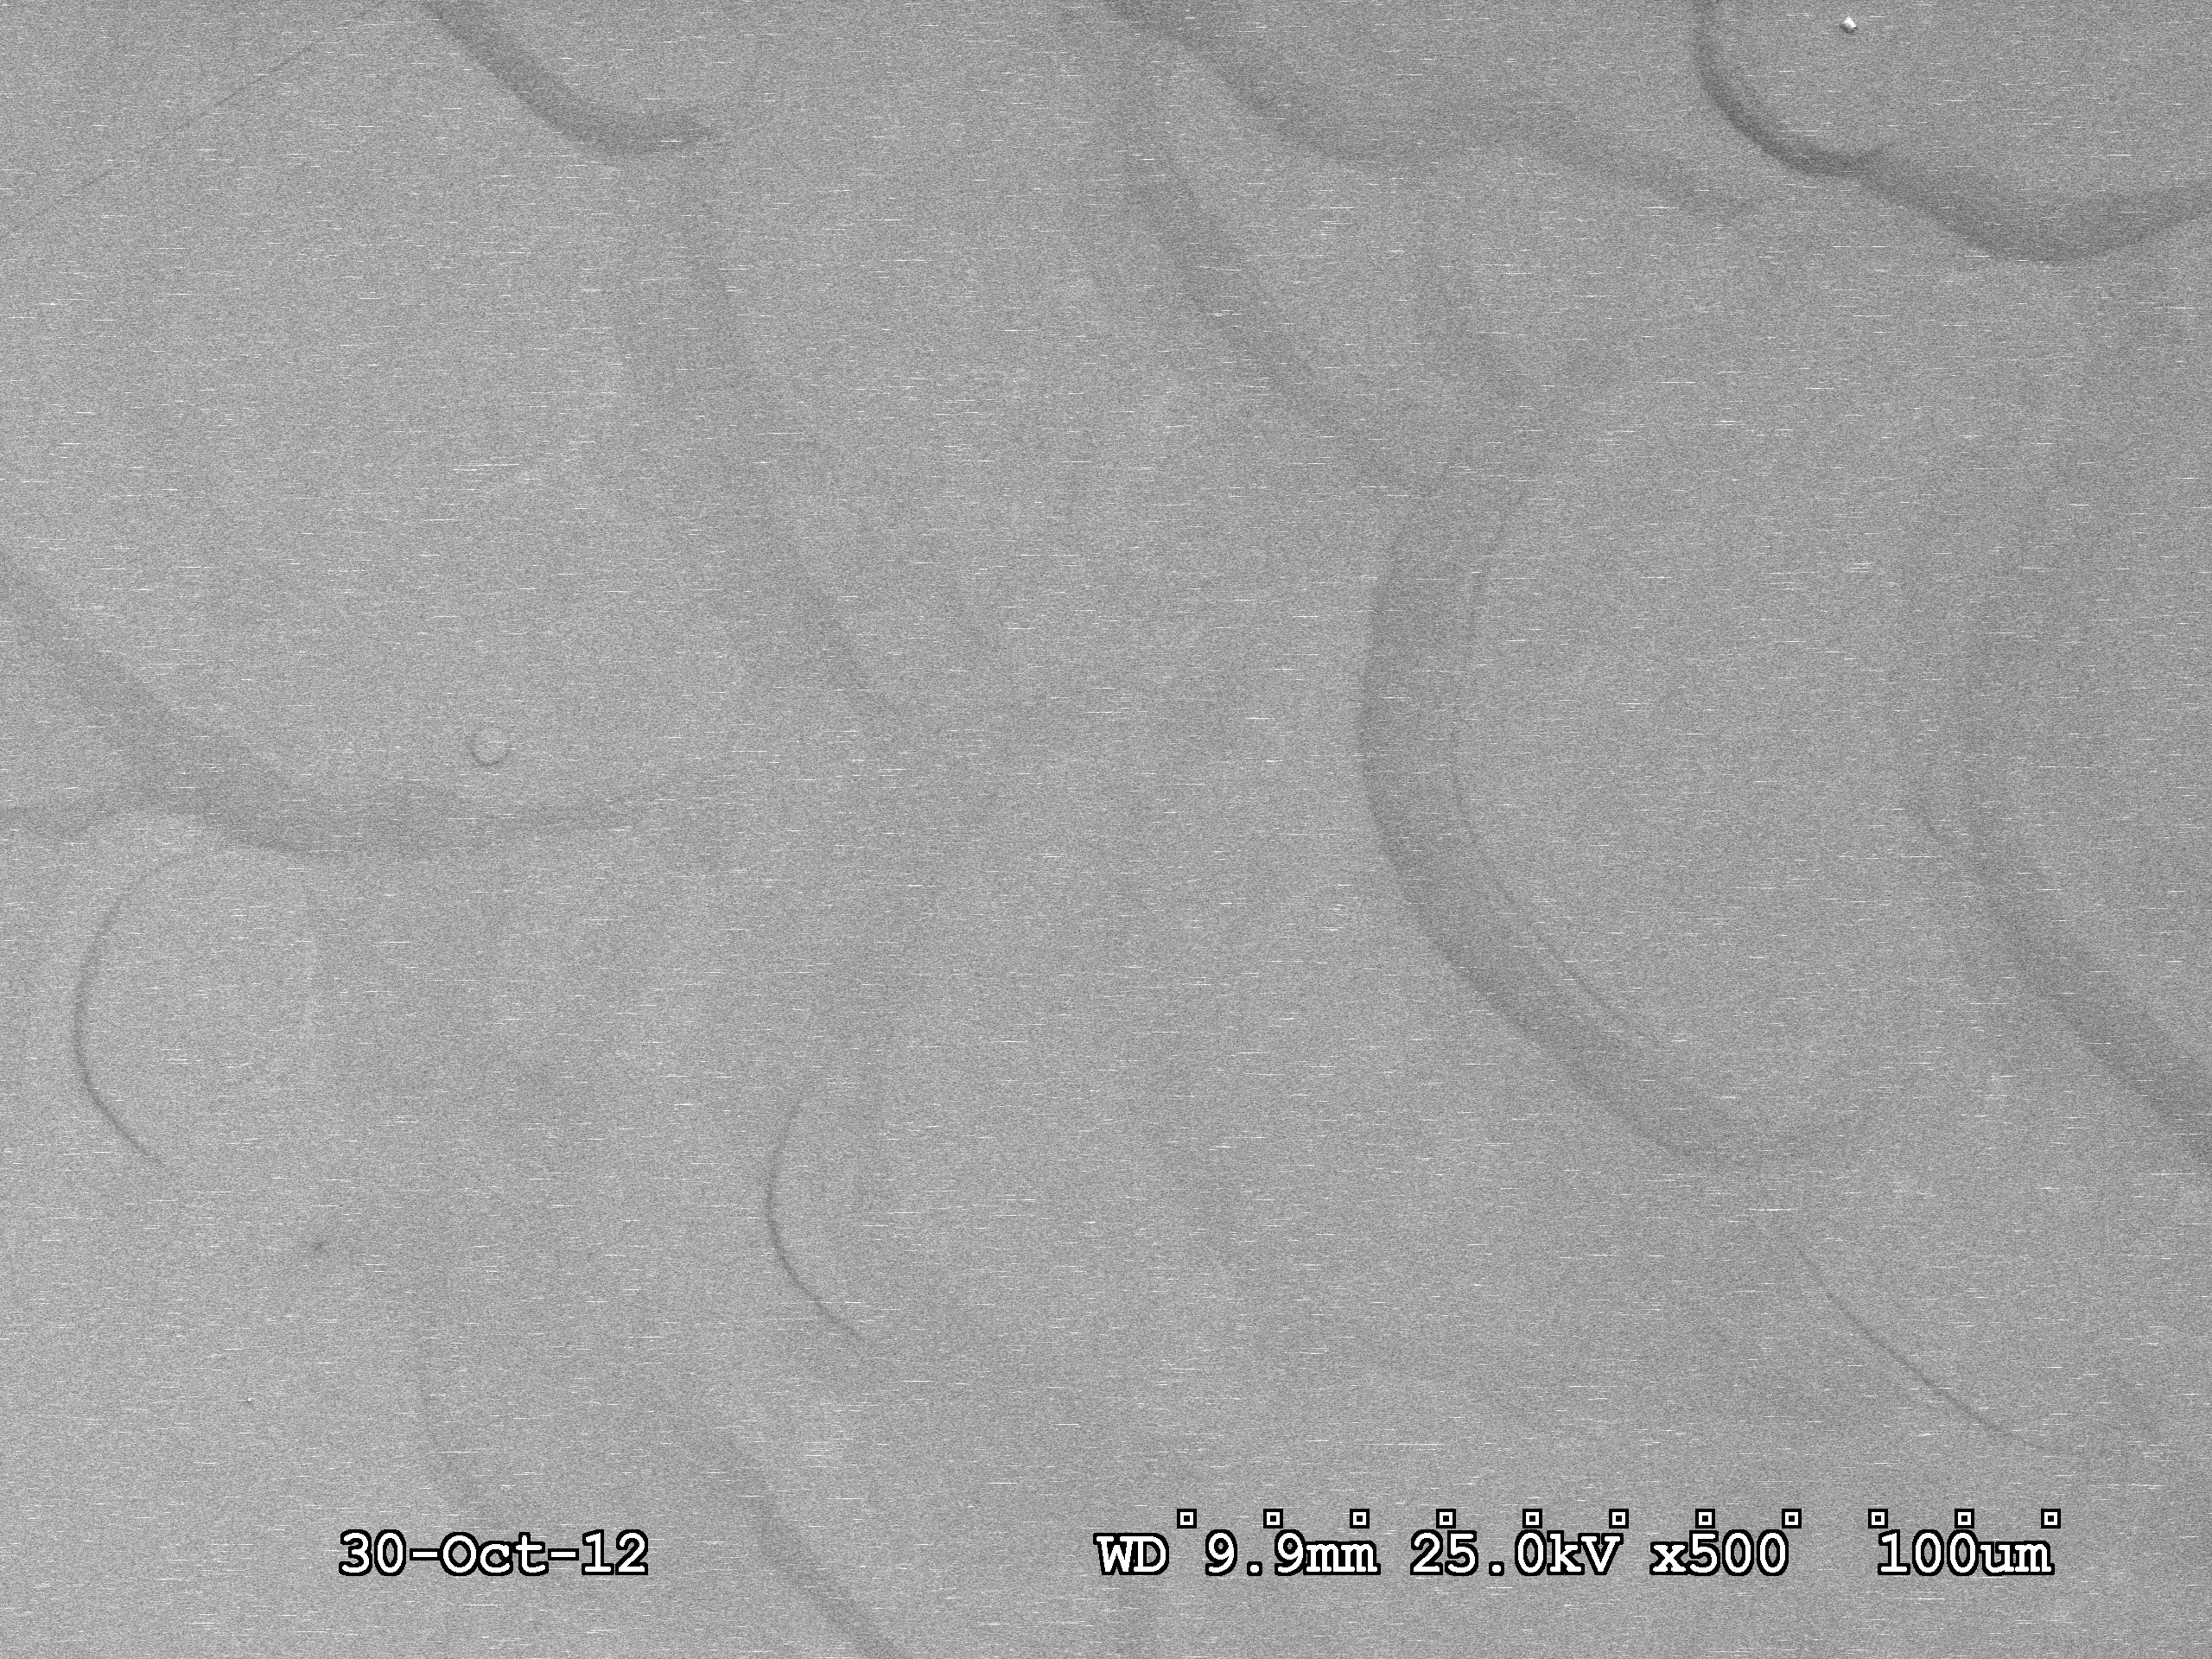
fig4i_GaNgrowth … step800min.bmp
image/x-ms-bmp (4MB)
Creative Commons: Attribution 4.0
Secondary Electron Image of the GaN growth (800min) obtained on the ELOG template region E used for figure 4i
4_1k_3260npe.bmp
image/x-ms-bmp (4MB)
Creative Commons: Attribution 4.0
Fig5a_Cathodolu … regionD.jpg
image/jpeg (184kB)
Creative Commons: Attribution 4.0
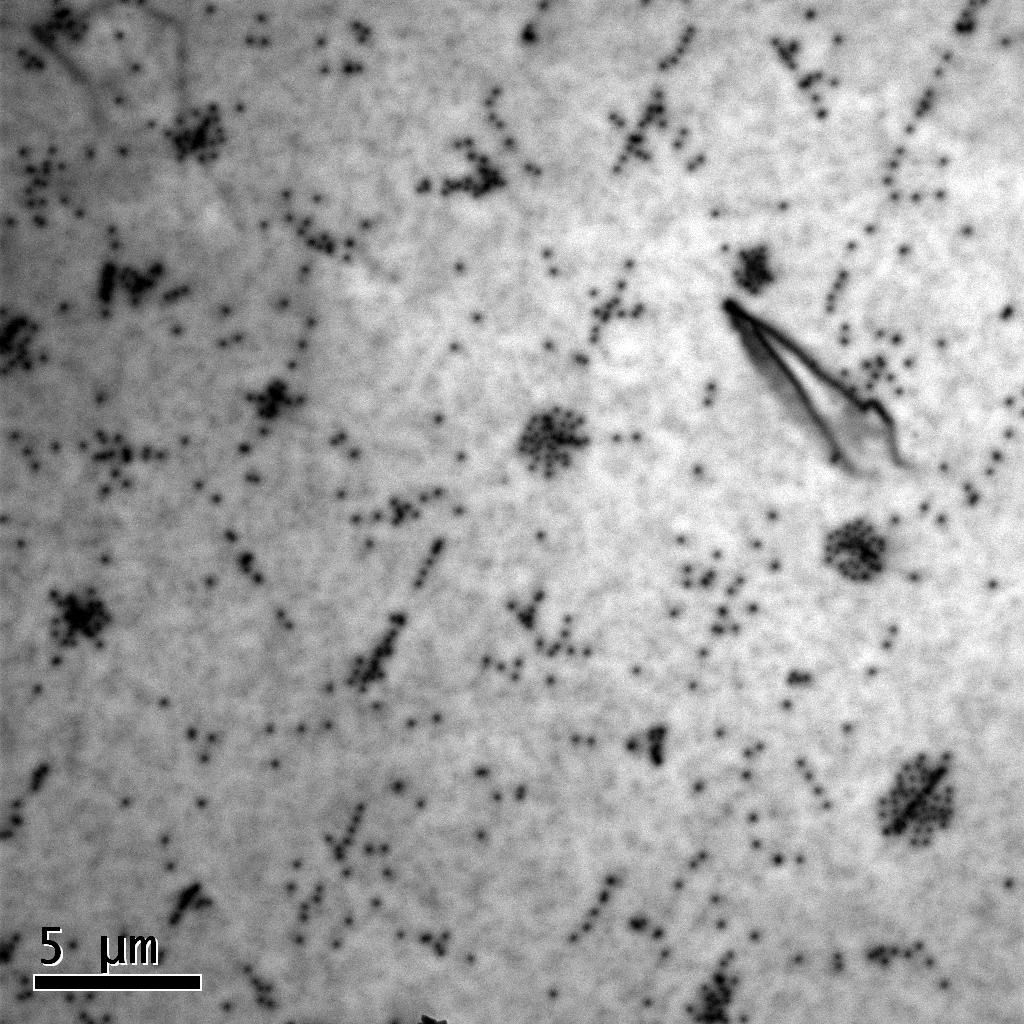
Cathodoluminescence Image of the GaN growth (800min) obtained on the ELOG template region D used for figure 5a
Fig5b_SEM_RegionD … step20min.bmp
image/x-ms-bmp (4MB)
Creative Commons: Attribution 4.0
Secondary Electron Image of the GaN growth (20min) obtained on the ELOG template region D used for figure 5b
Fig5c_SEM_RegionD … tep200min.bmp
image/x-ms-bmp (4MB)
Creative Commons: Attribution 4.0
Secondary Electron Image of the GaN growth (200min) obtained on the ELOG template region D used for figure 5c
fig6a_panchromatic … region_A.jpg
image/jpeg (179kB)
Creative Commons: Attribution 4.0
Panchromatic cathodoluminescence Image GaN layer obtained on the pendeo template region A used for figure 6a
fig6b_panchromatic … region_B.jpg
image/jpeg (163kB)
Creative Commons: Attribution 4.0
Panchromatic cathodoluminescence Image GaN layer obtained on the pendeo template region B used for figure 6b
fig6c_panchromatic … region_C.jpg
image/jpeg (148kB)
Creative Commons: Attribution 4.0
Panchromatic cathodoluminescence Image GaN layer obtained on the pendeo template region C used for figure 6c
fig6d_panchromatic … region_D.jpg
image/jpeg (191kB)
Creative Commons: Attribution 4.0
Panchromatic cathodoluminescence Image GaN layer obtained on the pendeo template region D used for figure 6d
fig6e_panchromatic … region_A.jpg
image/jpeg (177kB)
Creative Commons: Attribution 4.0
Panchromatic cathodoluminescence Image GaN layer obtained on the ELOG template region A used for figure 6e
fig6f_panchromatic … region_B.jpg
image/jpeg (150kB)
Creative Commons: Attribution 4.0
Panchromatic cathodoluminescence Image GaN layer obtained on the ELOG template region B used for figure 6f
fig6g_panchromatic … region_C.jpg
image/jpeg (238kB)
Creative Commons: Attribution 4.0
Panchromatic cathodoluminescence Image GaN layer obtained on the ELOG template region C used for figure 6g
fig6h_panchromatic … region_E.jpg
image/jpeg (158kB)
Creative Commons: Attribution 4.0
Fig7a_Panchromatic … sample.jpg
image/jpeg (212kB)
Creative Commons: Attribution 4.0
Panchromatic cathodoluminescence Image GaN layer obtained on the ELOG template region D used for figure 7a
fig7b_ECCI … regionD_ELOG.png
image/png (396kB)
Creative Commons: Attribution 4.0
Electron Channelling Contrast Image of the GaN layer obtained on the ELOG template region D used for figure 7b
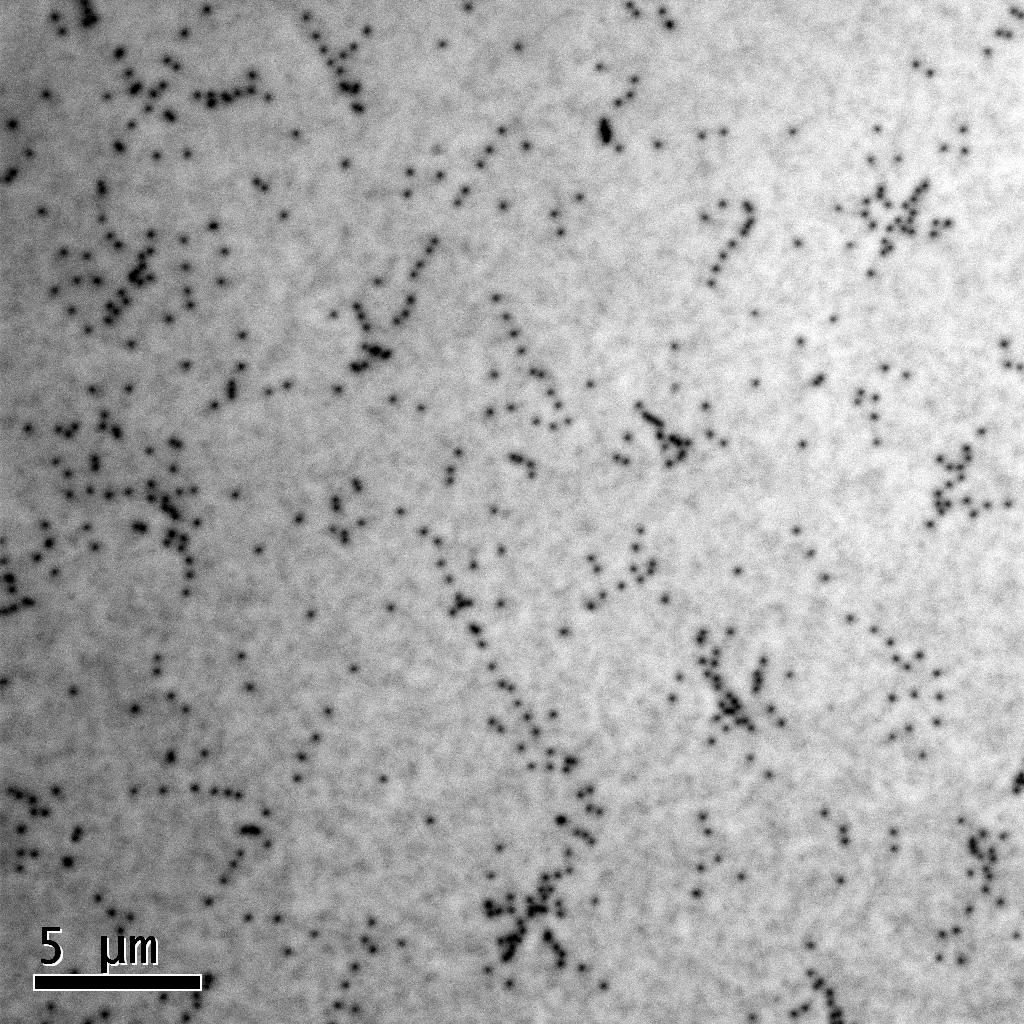
panchromaticCL_regionA_pendeo.jpg
image/jpeg (139kB)
Creative Commons: Attribution 4.0
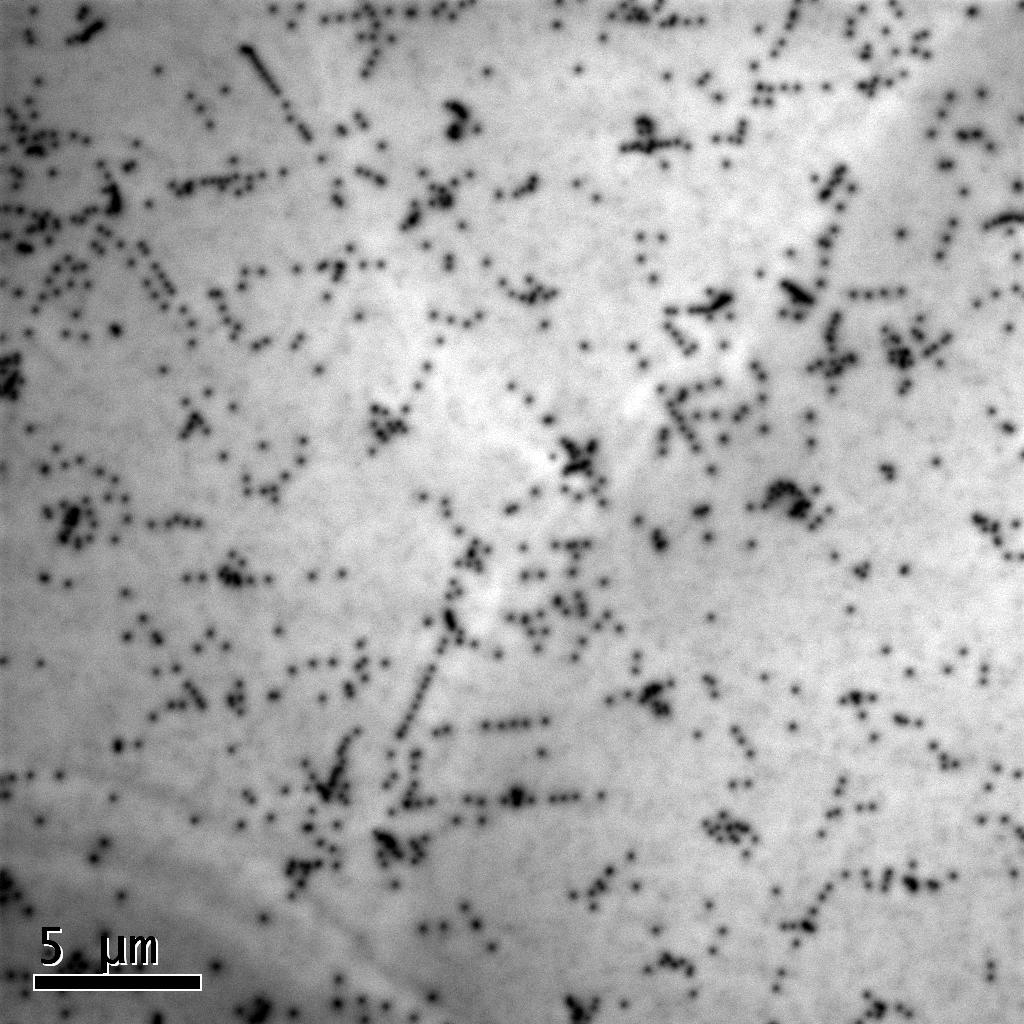
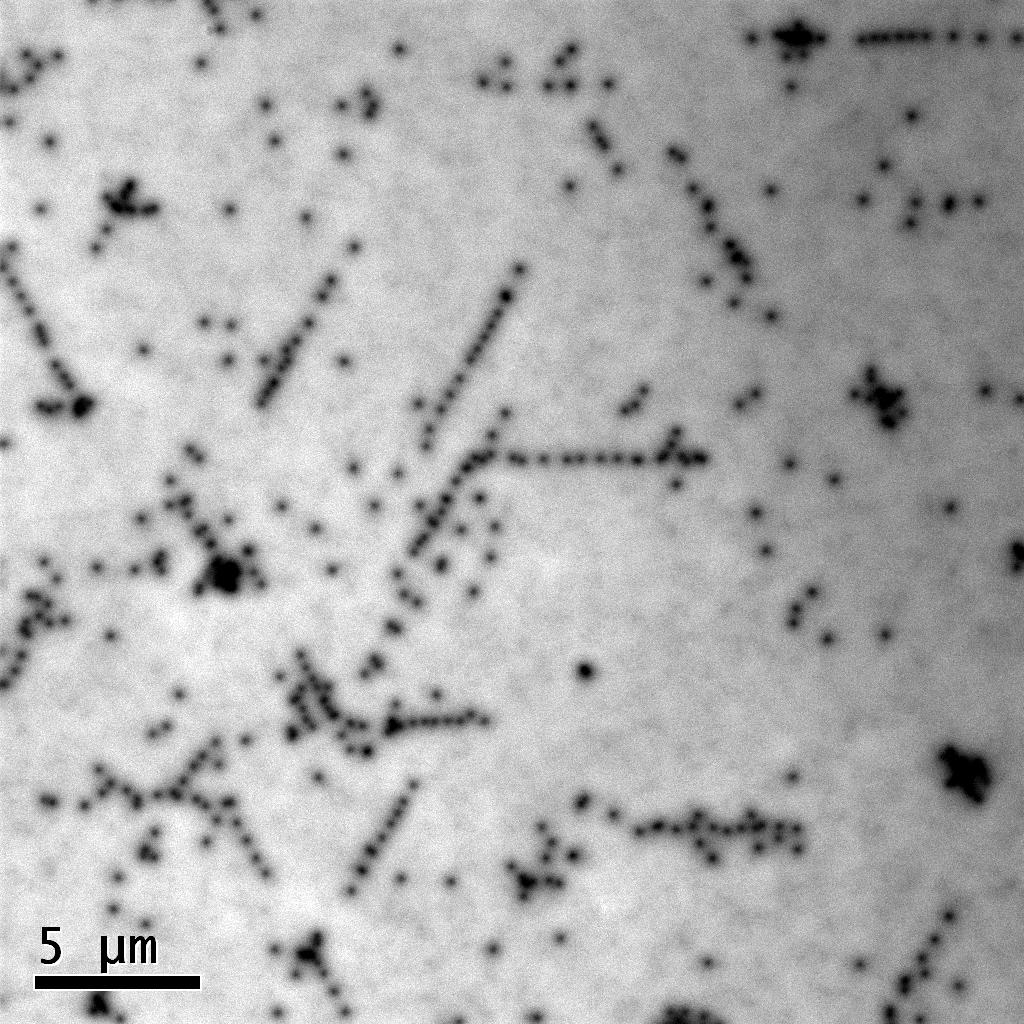
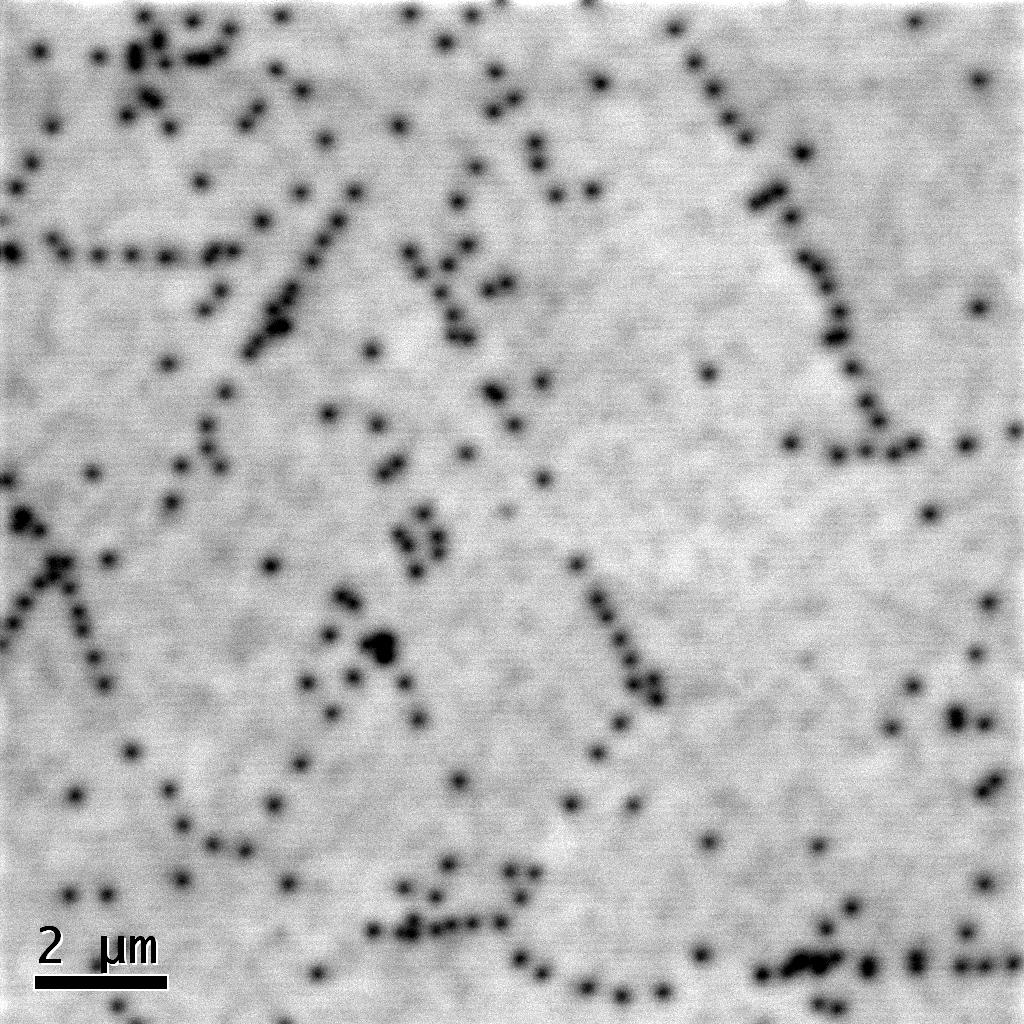
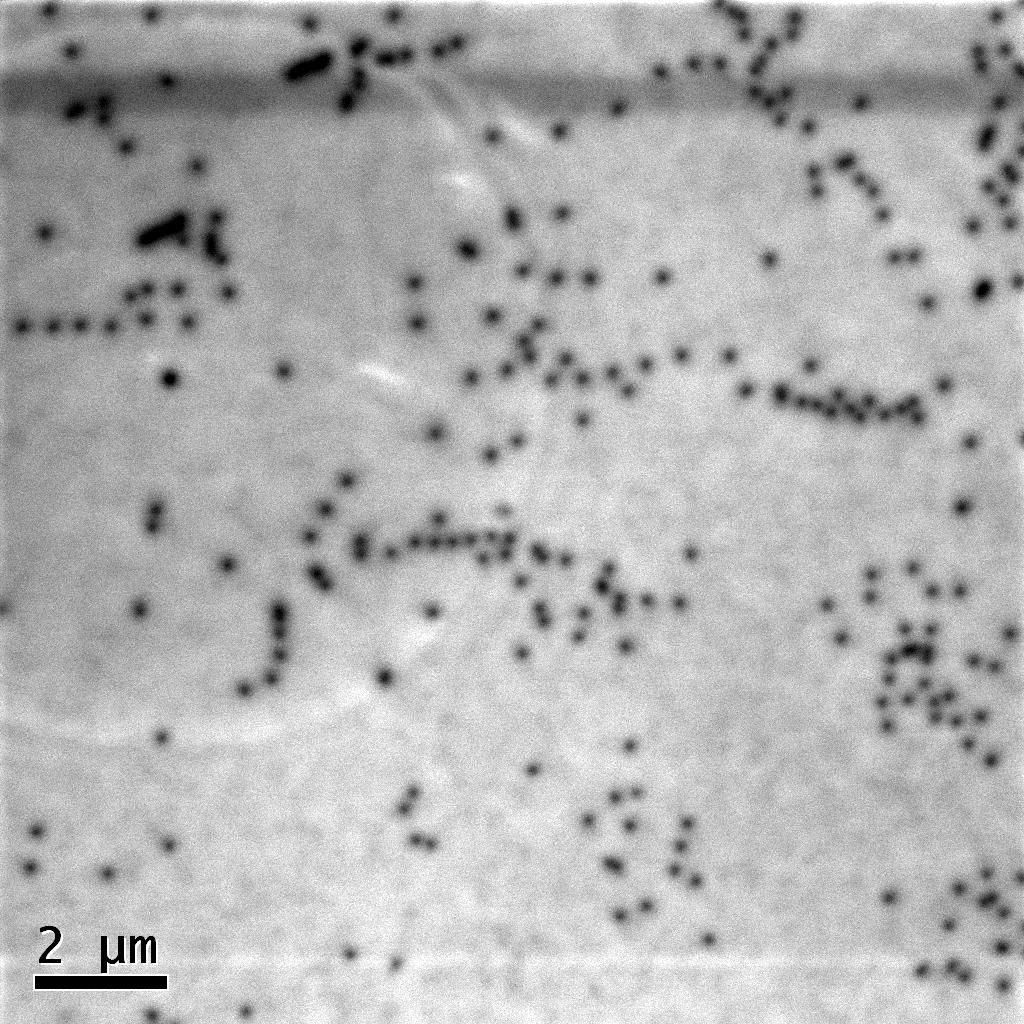
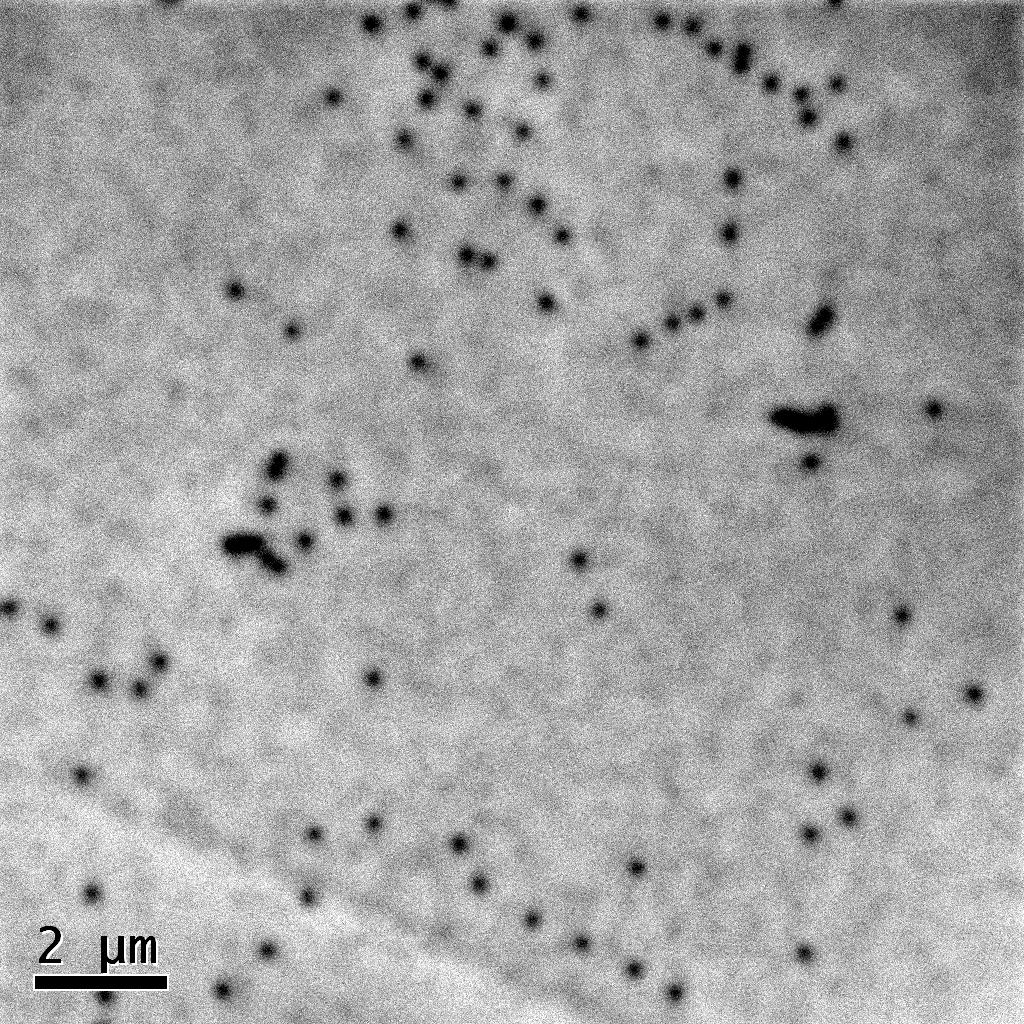
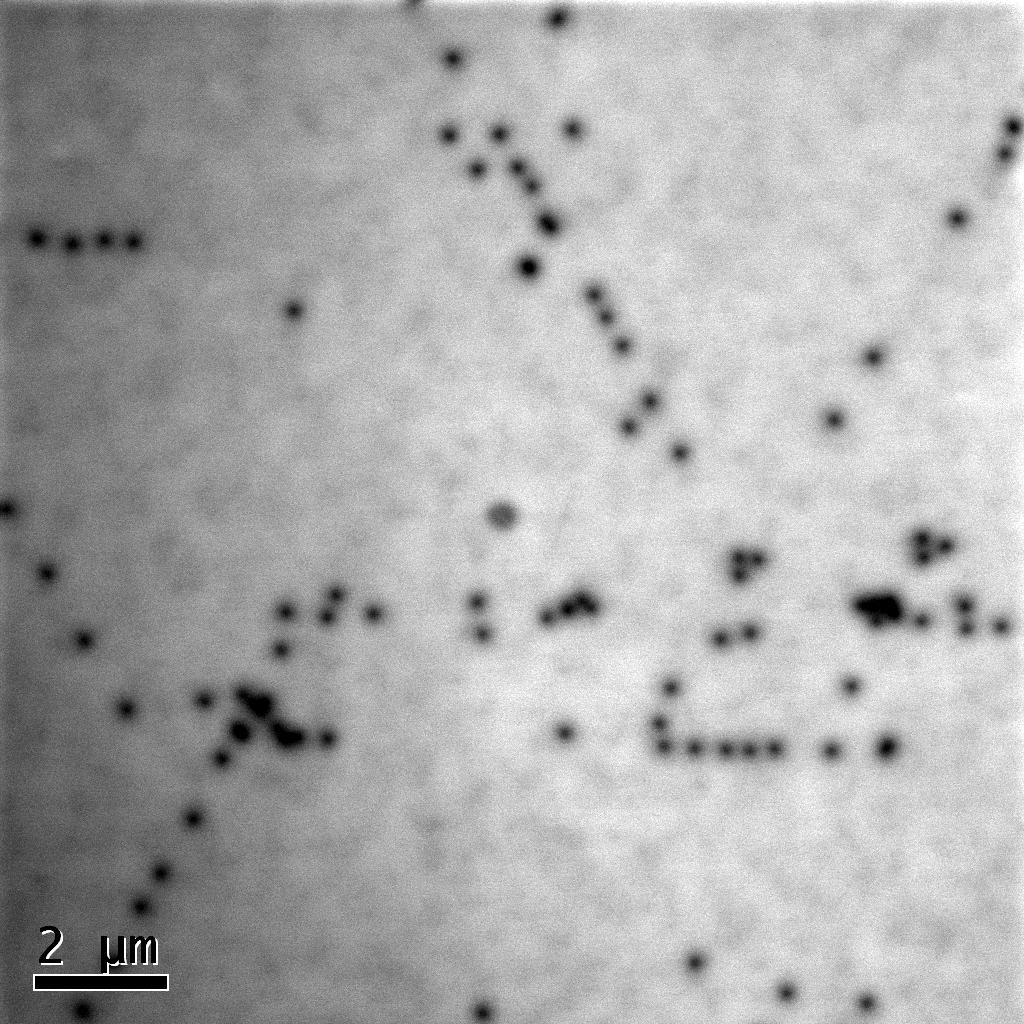
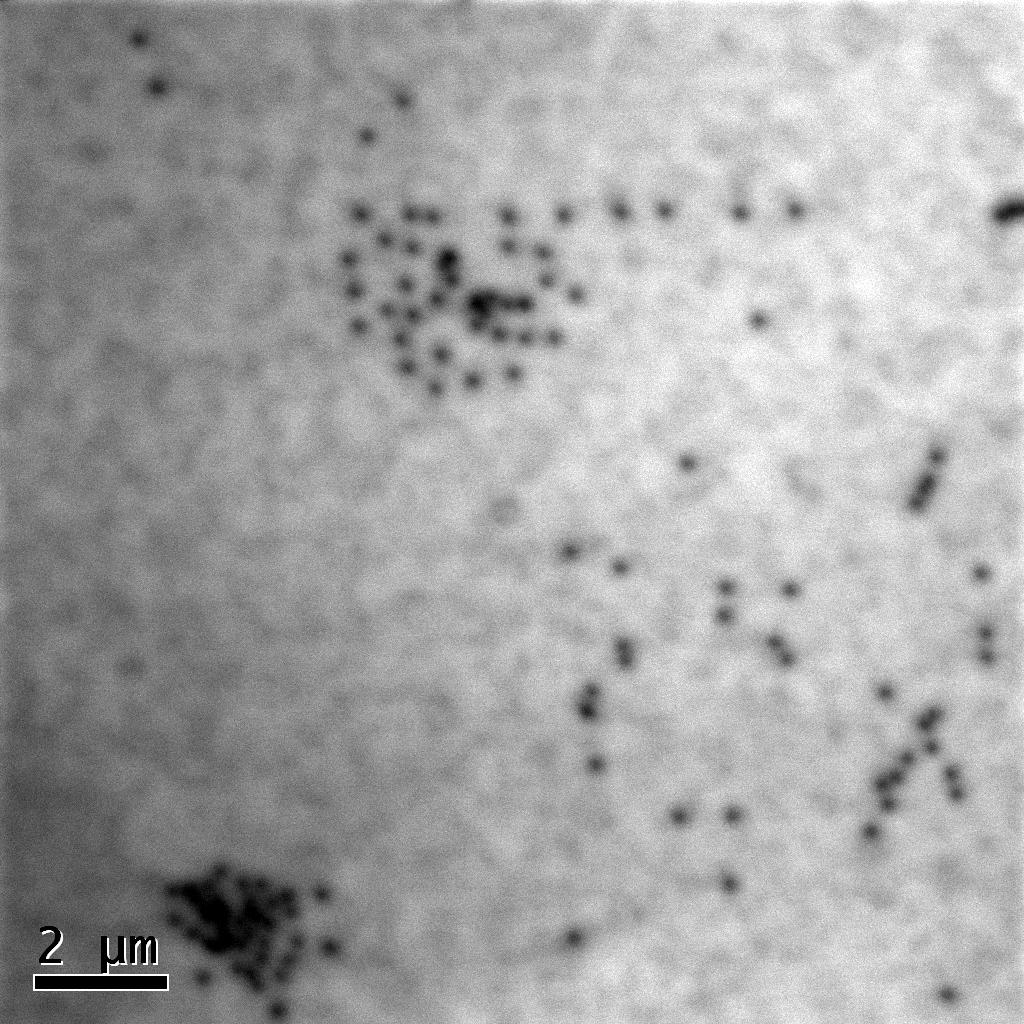
Panchromatic Cathodoluminescence image obtained on the region A on the pendeo template. Used to calculate dislocation density reported in Fig8
panchromaticCL_regionB_pendeo.jpg
image/jpeg (185kB)
Creative Commons: Attribution 4.0
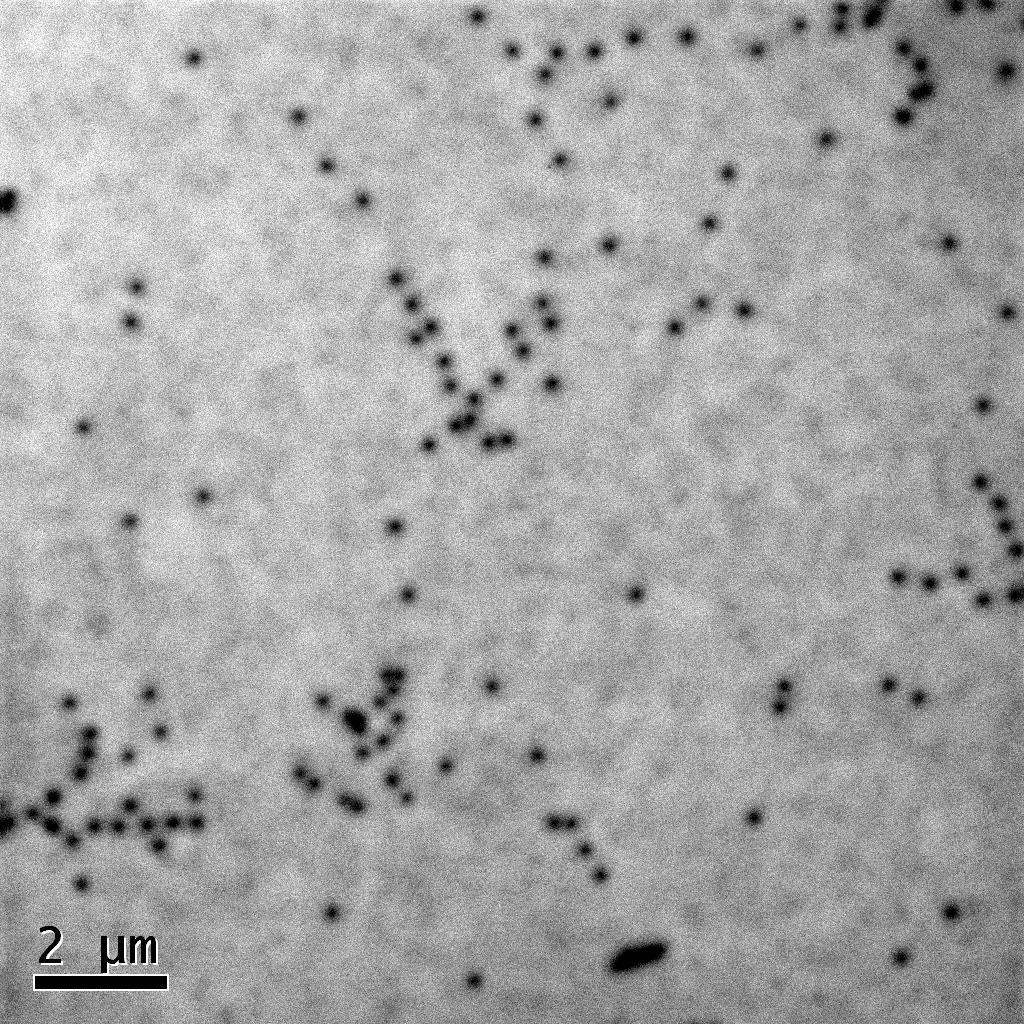
panchromaticCL_regionC_pendeo.jpg
image/jpeg (190kB)
Creative Commons: Attribution 4.0
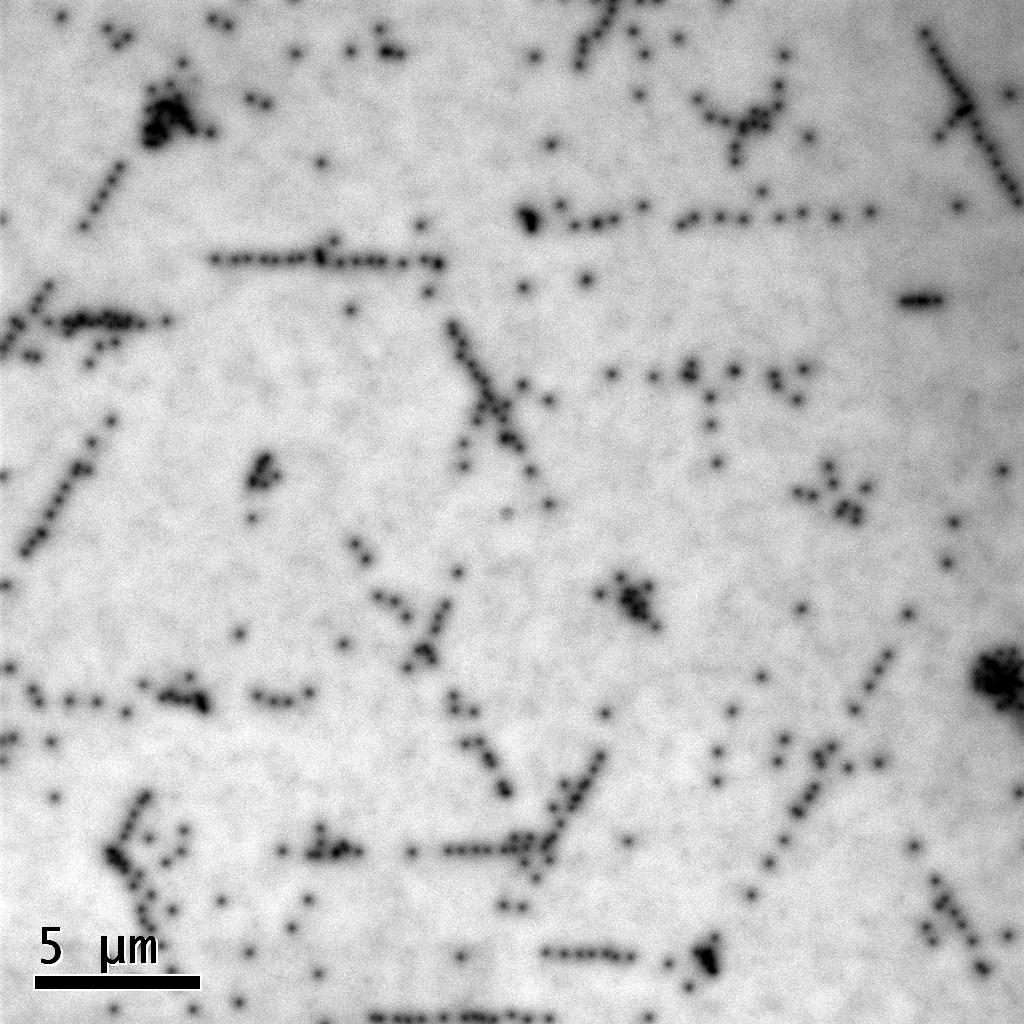
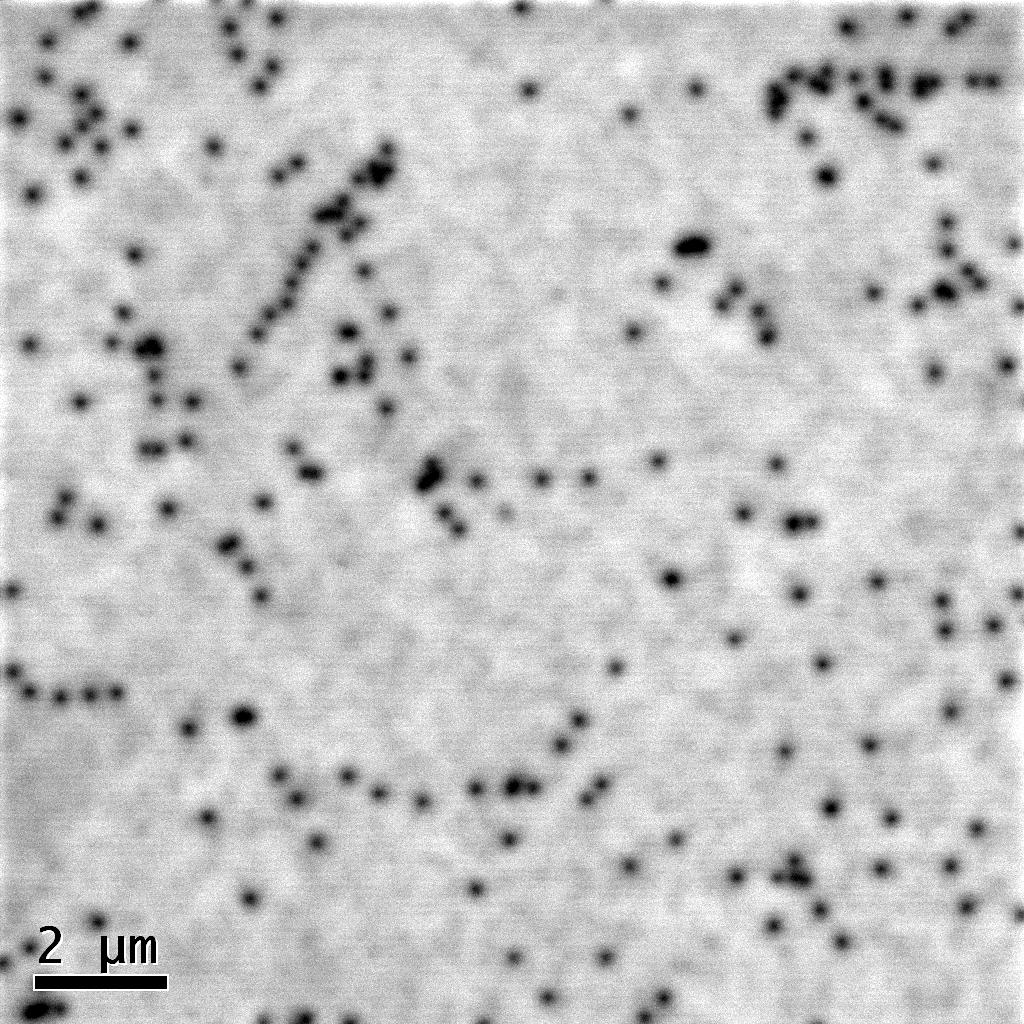
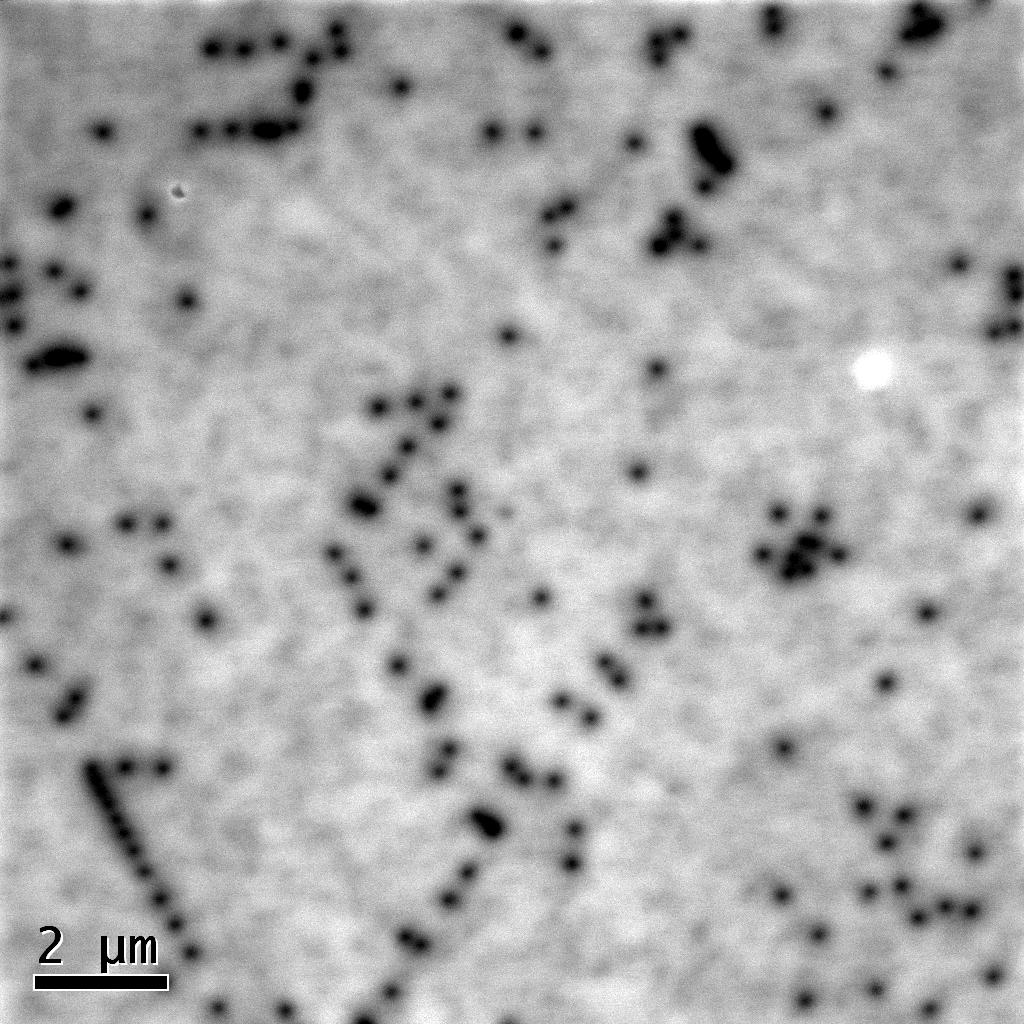
Panchromatic Cathodoluminescence image obtained on the region C on the pendeo template. Used to calculate dislocation density reported in Fig8
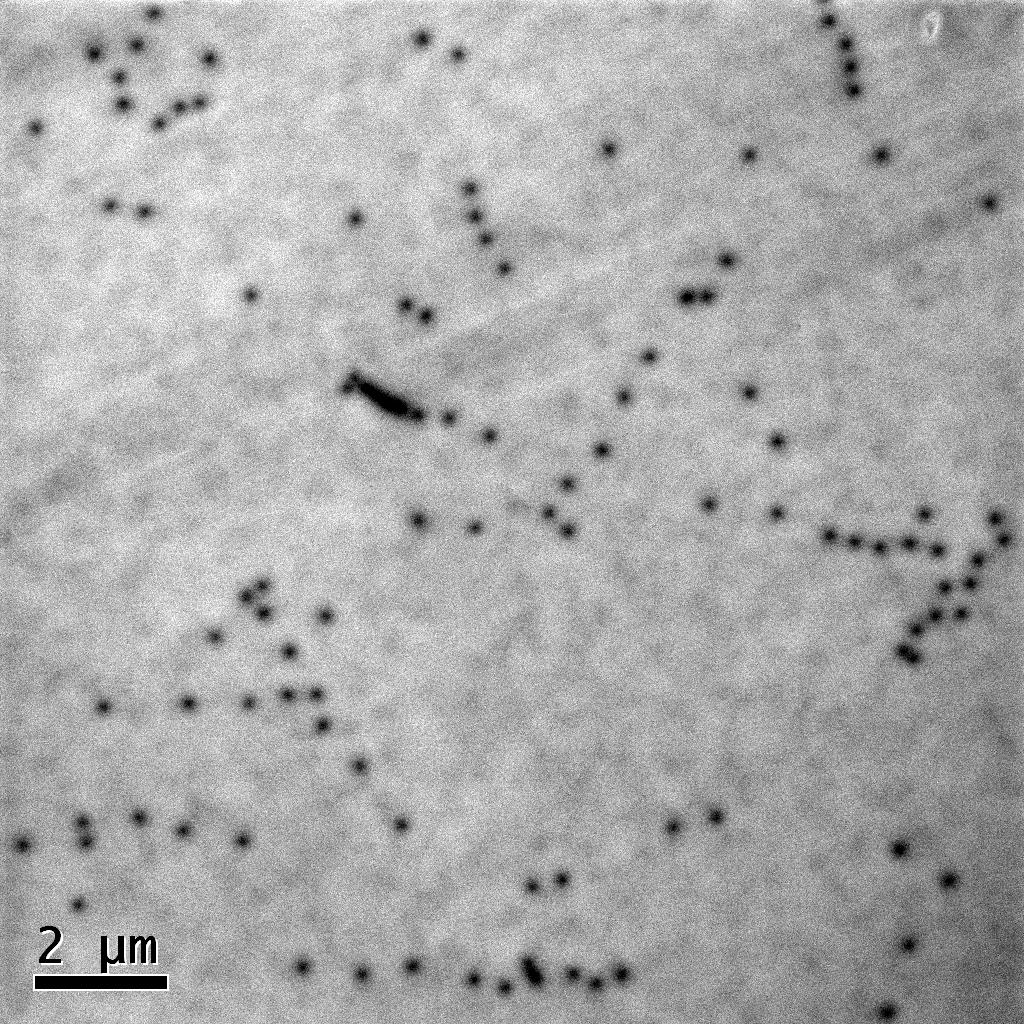
panchromaticCL_regionD_pendeo.jpg
image/jpeg (191kB)
Creative Commons: Attribution 4.0
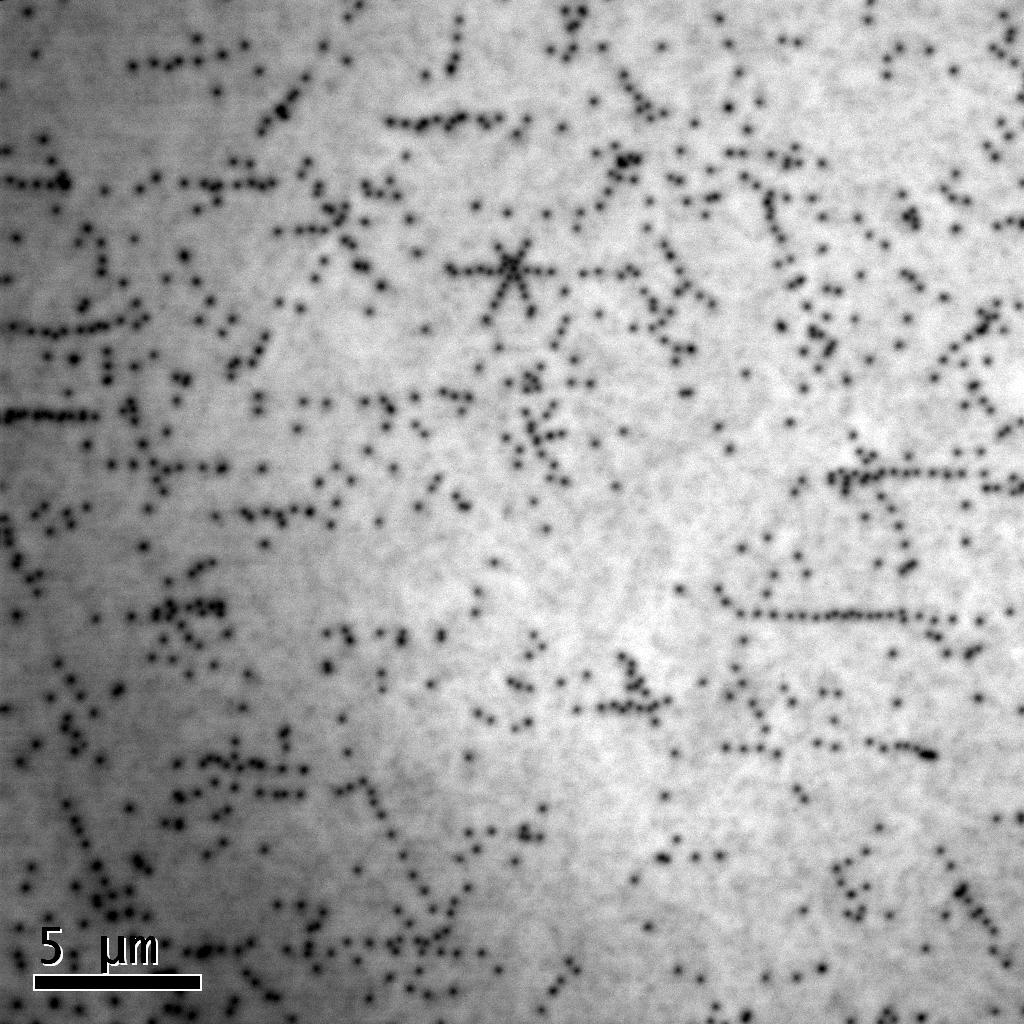
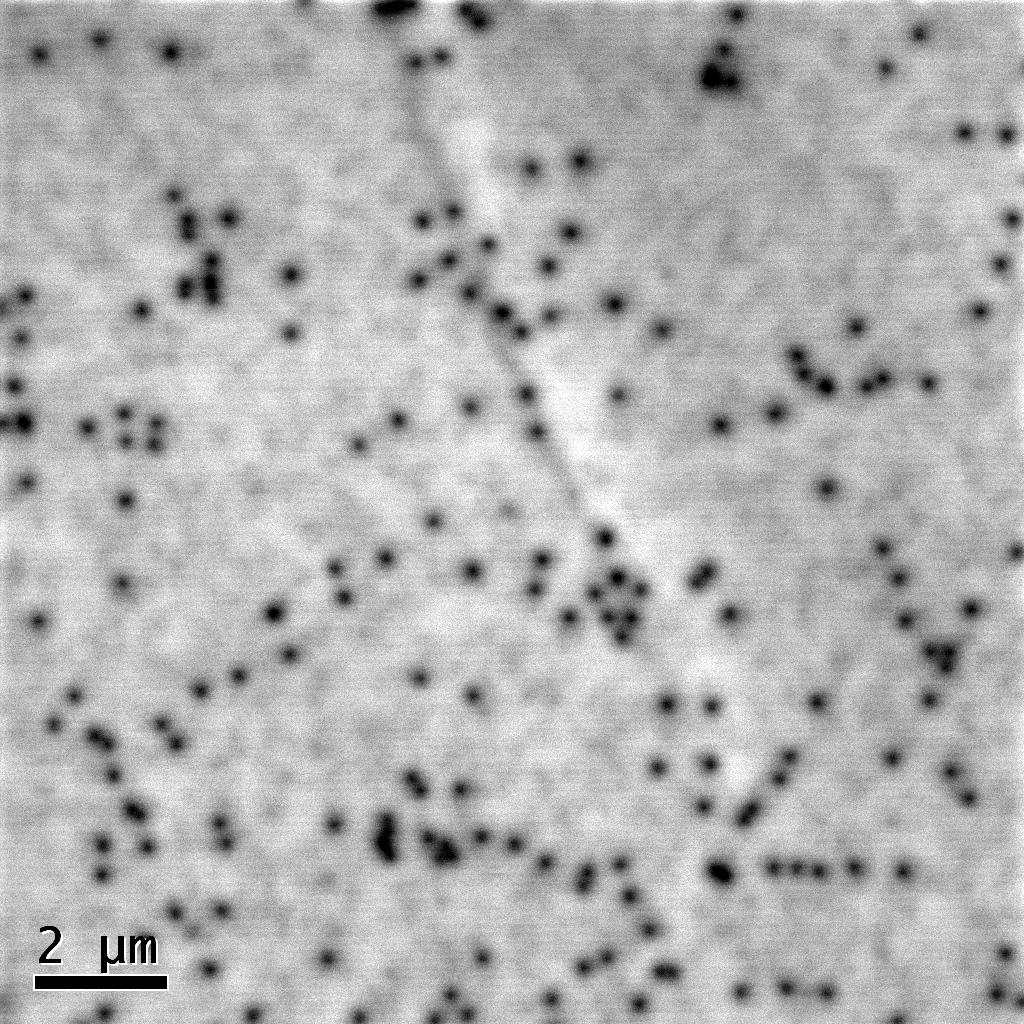
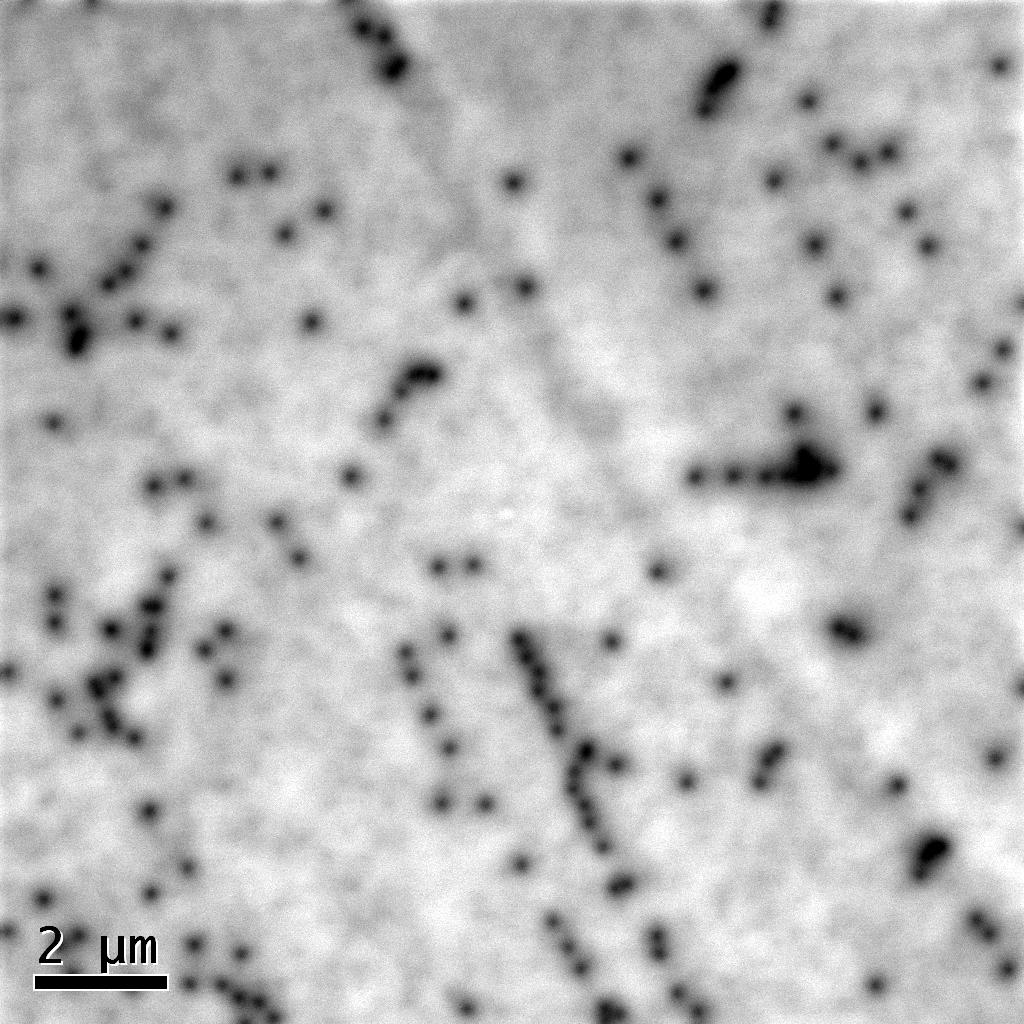
Panchromatic Cathodoluminescence image obtained on the region D on the pendeo template. Used to calculate dislocation density reported in Fig8
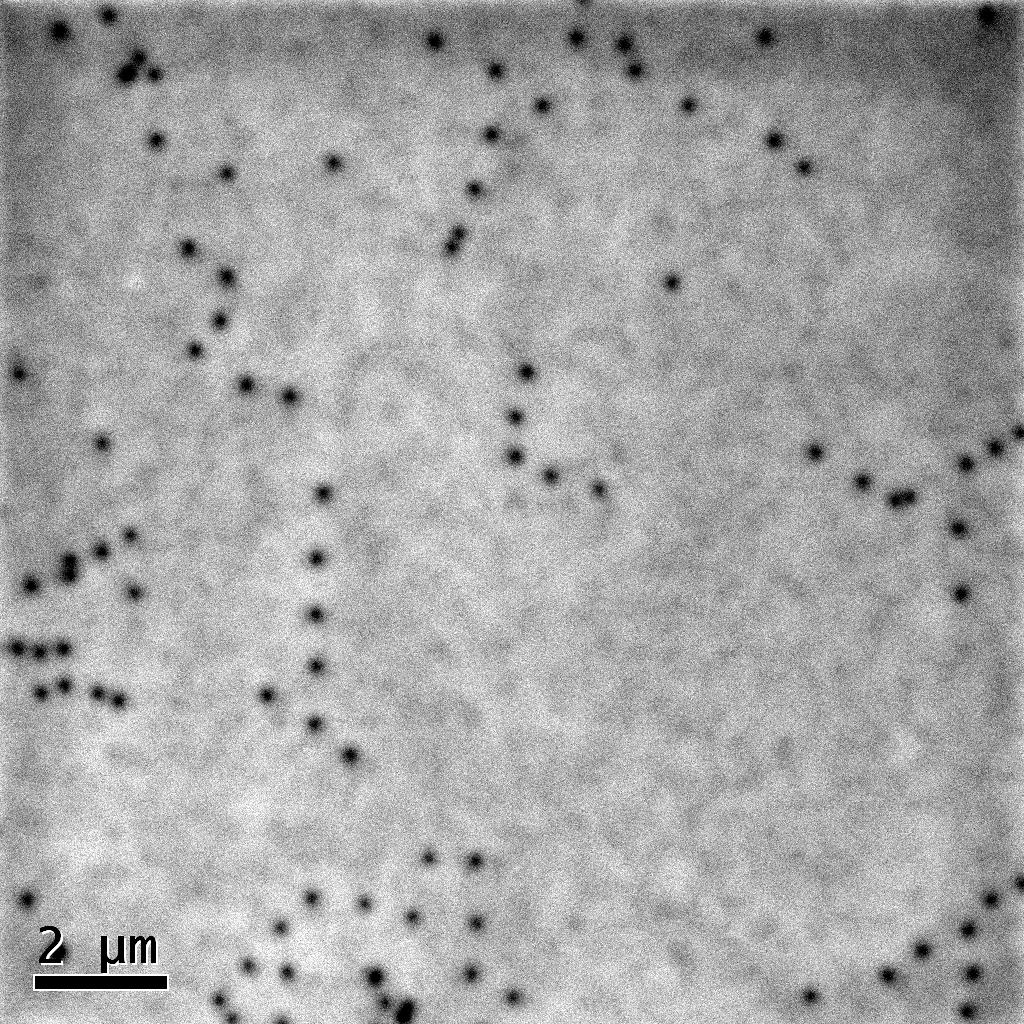
Panchromatic_CL_RegionA_i.jpg
image/jpeg (248kB)
Creative Commons: Attribution 4.0
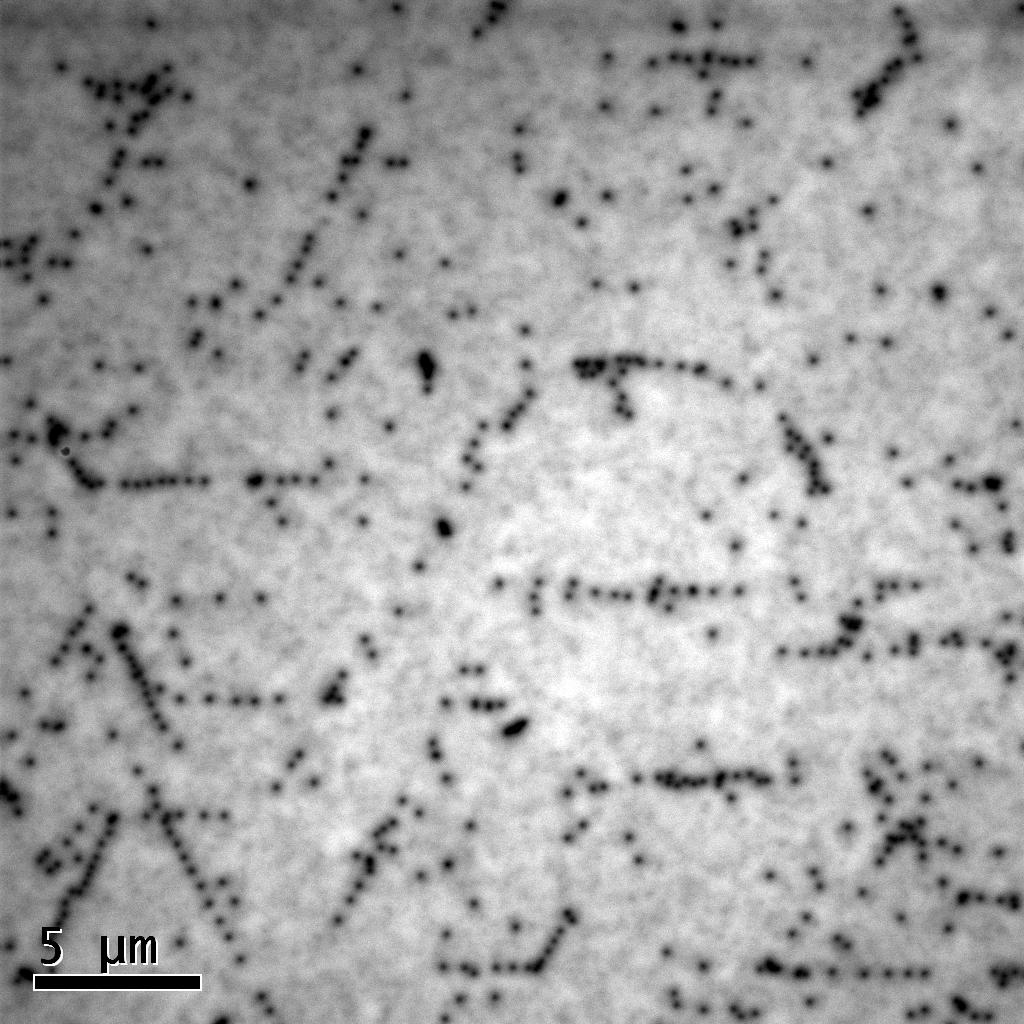
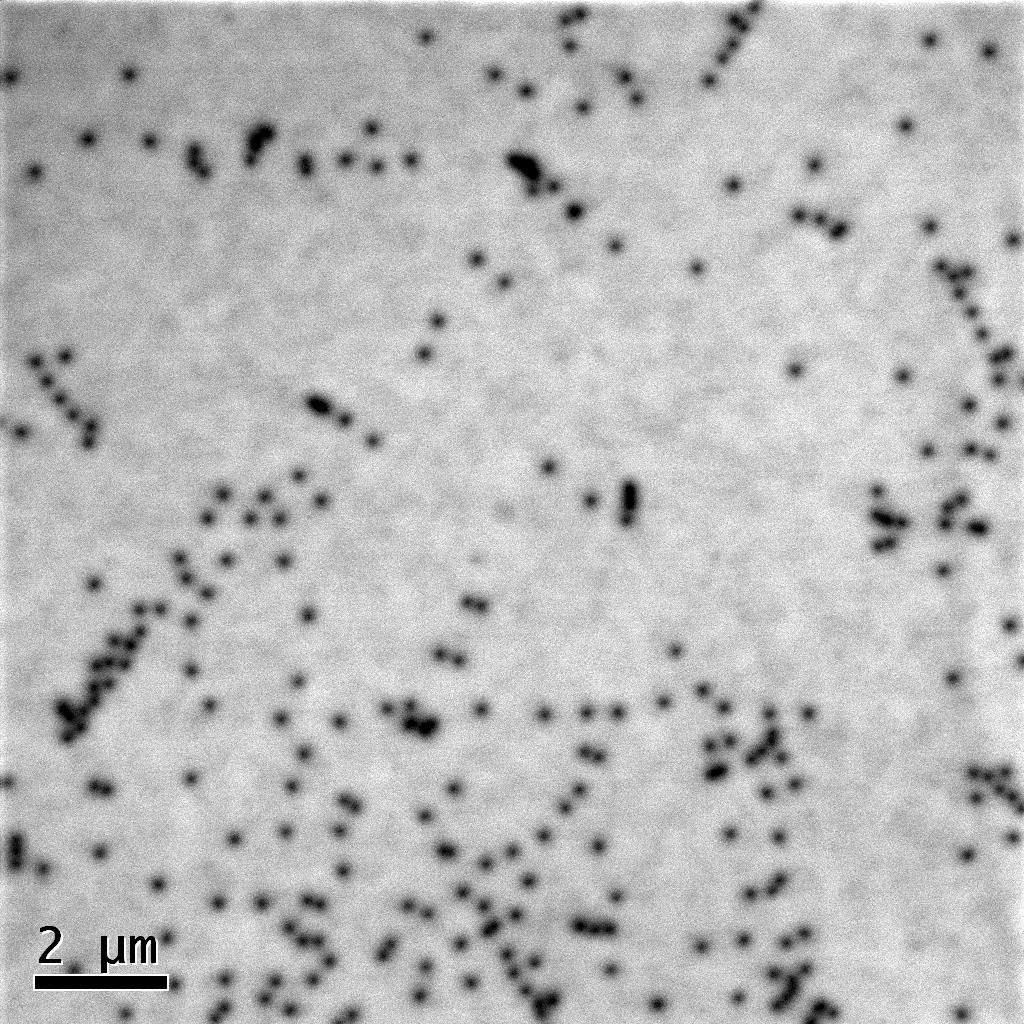
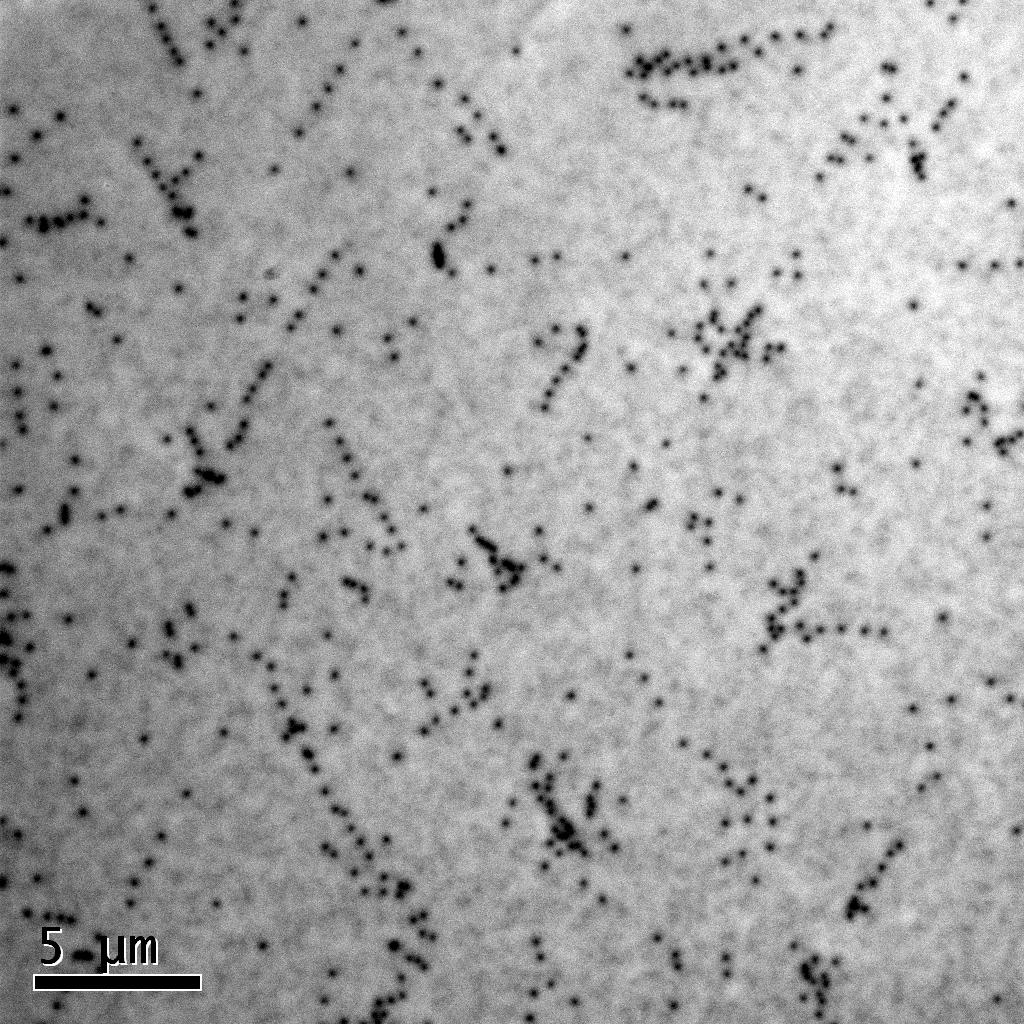
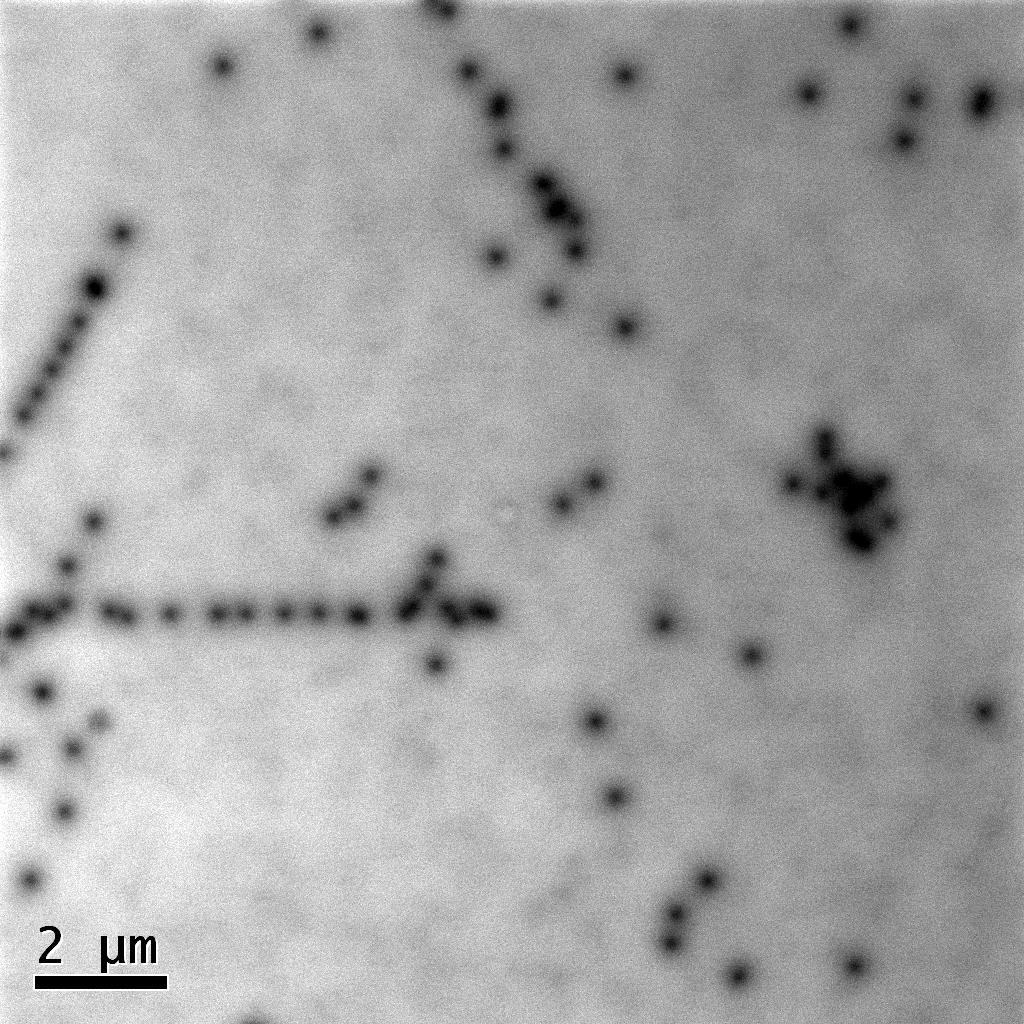
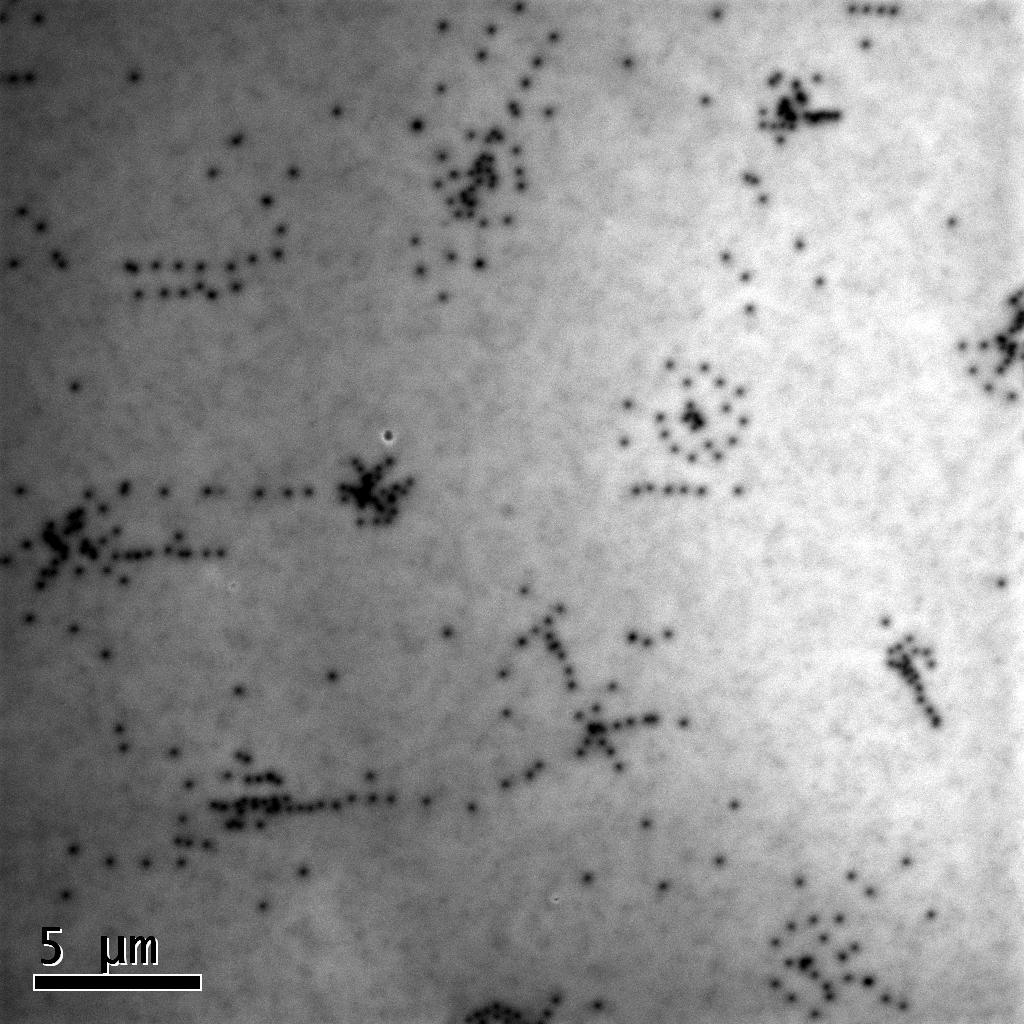
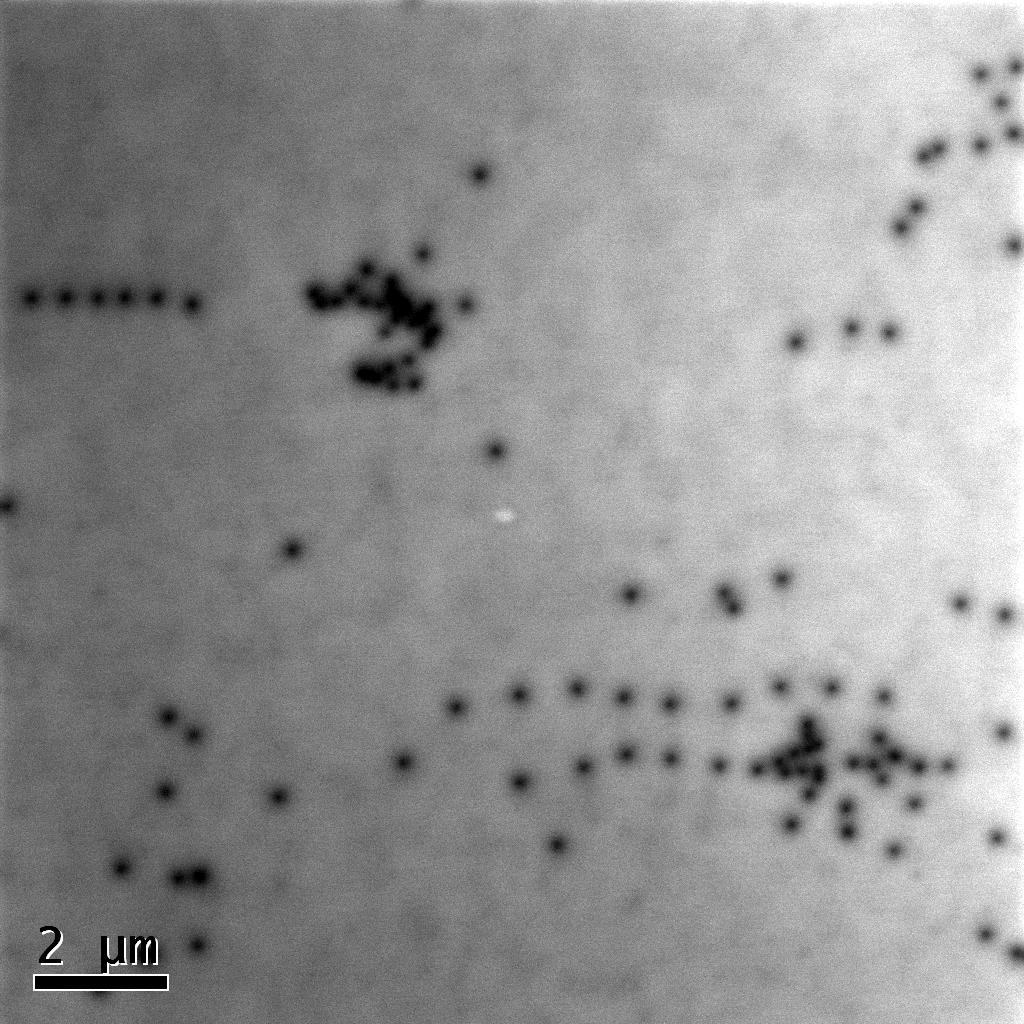
Panchromatic Cathodoluminescence image obtained on the region A on the ELOG template. Used to calculate dislocation density reported in Fig8
Panchromatic_CL_RegionA_j.jpg
image/jpeg (249kB)
Creative Commons: Attribution 4.0
Panchromatic Cathodoluminescence image obtained on the region A on the ELOG template. Used to calculate dislocation density reported in Fig8
Panchromatic_CL_RegionA_k.jpg
image/jpeg (241kB)
Creative Commons: Attribution 4.0
Panchromatic Cathodoluminescence image obtained on the region A on the ELOG template. Used to calculate dislocation density reported in Fig8
Panchromatic_CL_RegionA_l.jpg
image/jpeg (265kB)
Creative Commons: Attribution 4.0
Panchromatic_CL_RegionA_m.jpg
image/jpeg (238kB)
Creative Commons: Attribution 4.0
Panchromatic Cathodoluminescence image obtained on the region A on the ELOG template. Used to calculate dislocation density reported in Fig8
Panchromatic_CL_RegionB_j.jpg
image/jpeg (179kB)
Creative Commons: Attribution 4.0
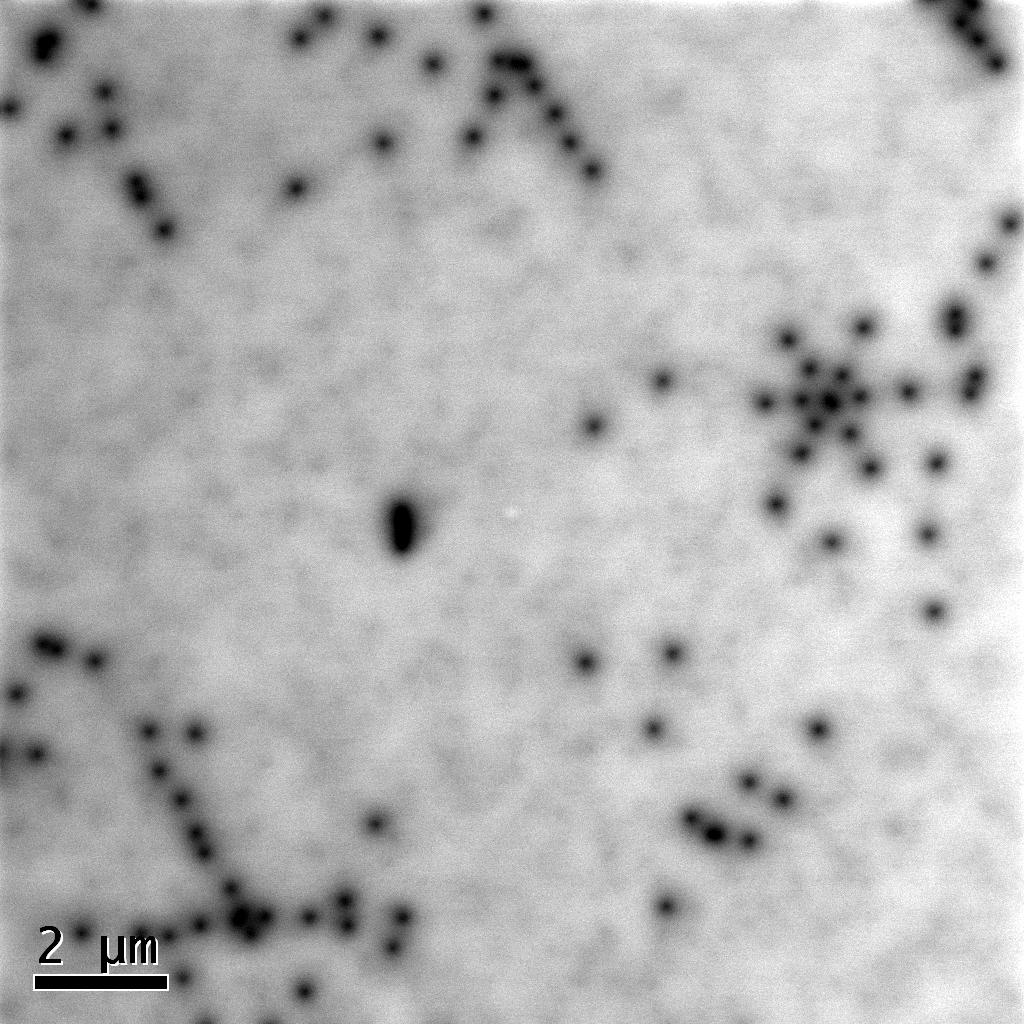
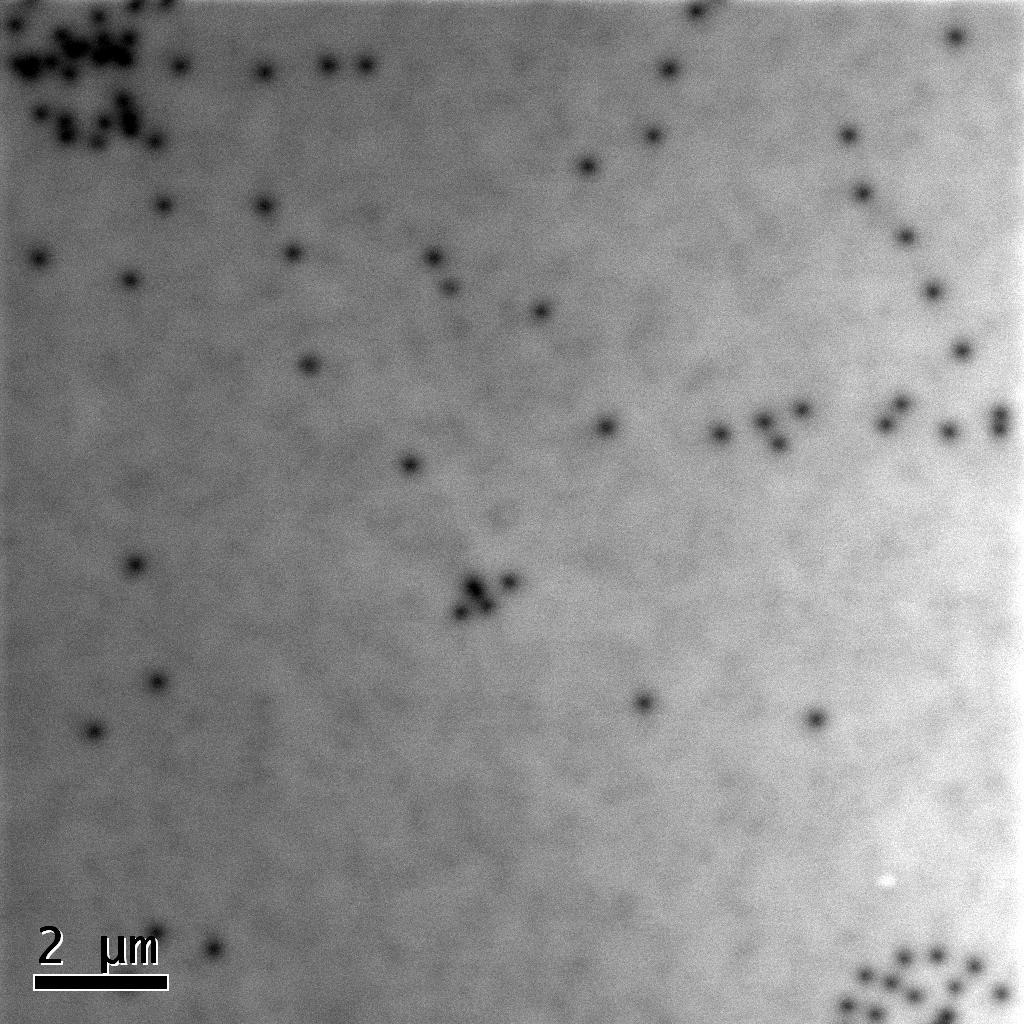
Panchromatic Cathodoluminescence image obtained on the region B on the ELOG template. Used to calculate dislocation density reported in Fig8
Panchromatic_CL_RegionB_k.jpg
image/jpeg (169kB)
Creative Commons: Attribution 4.0
Panchromatic Cathodoluminescence image obtained on the region B on the ELOG template. Used to calculate dislocation density reported in Fig8
Panchromatic_CL_RegionB_l.jpg
image/jpeg (155kB)
Creative Commons: Attribution 4.0
Panchromatic Cathodoluminescence image obtained on the region B on the ELOG template. Used to calculate dislocation density reported in Fig8
Panchromatic_CL_RegionC_e.jpg
image/jpeg (252kB)
Creative Commons: Attribution 4.0
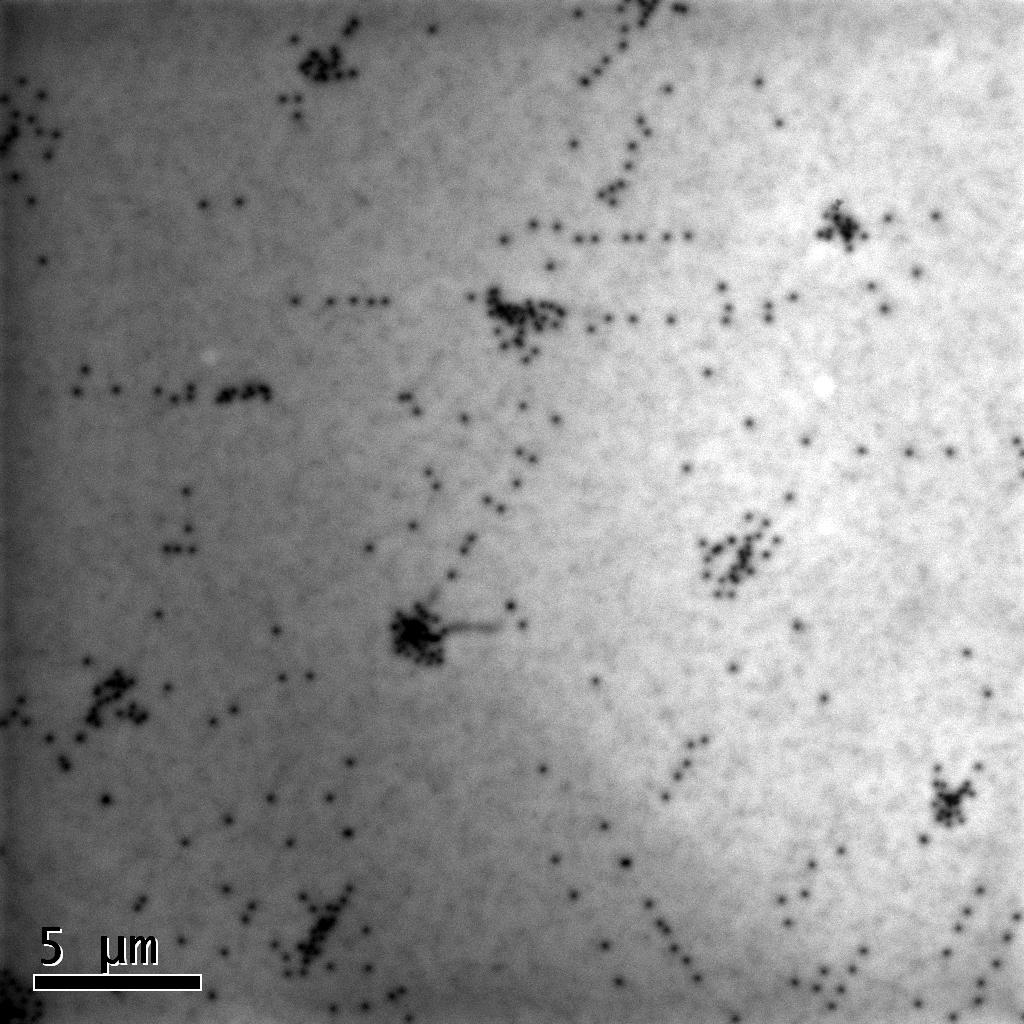
Panchromatic Cathodoluminescence image obtained on the region C on the ELOG template. Used to calculate dislocation density reported in Fig8
Panchromatic_CL_RegionC_f.jpg
image/jpeg (238kB)
Creative Commons: Attribution 4.0
Panchromatic Cathodoluminescence image obtained on the region C on the ELOG template. Used to calculate dislocation density reported in Fig8
Panchromatic_CL_RegionC_g.jpg
image/jpeg (328kB)
Creative Commons: Attribution 4.0
Panchromatic Cathodoluminescence image obtained on the region C on the ELOG template. Used to calculate dislocation density reported in Fig8
Panchromatic_CL_RegionC_h.jpg
image/jpeg (327kB)
Creative Commons: Attribution 4.0
Panchromatic Cathodoluminescence image obtained on the region C on the ELOG template. Used to calculate dislocation density reported in Fig8
Panchromatic_CL_RegionC_i.jpg
image/jpeg (357kB)
Creative Commons: Attribution 4.0
Panchromatic Cathodoluminescence image obtained on the region C on the ELOG template. Used to calculate dislocation density reported in Fig8
Panchromatic_CL_RegionC_j.jpg
image/jpeg (378kB)
Creative Commons: Attribution 4.0
Panchromatic Cathodoluminescence image obtained on the region C on the ELOG template. Used to calculate dislocation density reported in Fig8
Panchromatic_CL_RegionD_f.jpg
image/jpeg (191kB)
Creative Commons: Attribution 4.0
Panchromatic Cathodoluminescence image obtained on the region D on the ELOG template. Used to calculate dislocation density reported in Fig8
Panchromatic_CL_RegionD_g.jpg
image/jpeg (212kB)
Creative Commons: Attribution 4.0
Panchromatic_CL_RegionD_h.jpg
image/jpeg (225kB)
Creative Commons: Attribution 4.0
Panchromatic Cathodoluminescence image obtained on the region D on the ELOG template. Used to calculate dislocation density reported in Fig8
Panchromatic_CL_RegionD_i.jpg
image/jpeg (242kB)
Creative Commons: Attribution 4.0
Panchromatic Cathodoluminescence image obtained on the region D on the ELOG template. Used to calculate dislocation density reported in Fig8
Panchromatic_CL_RegionD_j.jpg
image/jpeg (154kB)
Creative Commons: Attribution 4.0
Panchromatic Cathodoluminescence image obtained on the region D on the ELOG template. Used to calculate dislocation density reported in Fig8
Panchromatic_CL_RegionD_k.jpg
image/jpeg (168kB)
Creative Commons: Attribution 4.0
Panchromatic Cathodoluminescence image obtained on the region D on the ELOG template. Used to calculate dislocation density reported in Fig8
Panchromatic_CL_RegionE_d.jpg
image/jpeg (162kB)
Creative Commons: Attribution 4.0
Panchromatic_CL_RegionE_e.jpg
image/jpeg (201kB)
Creative Commons: Attribution 4.0
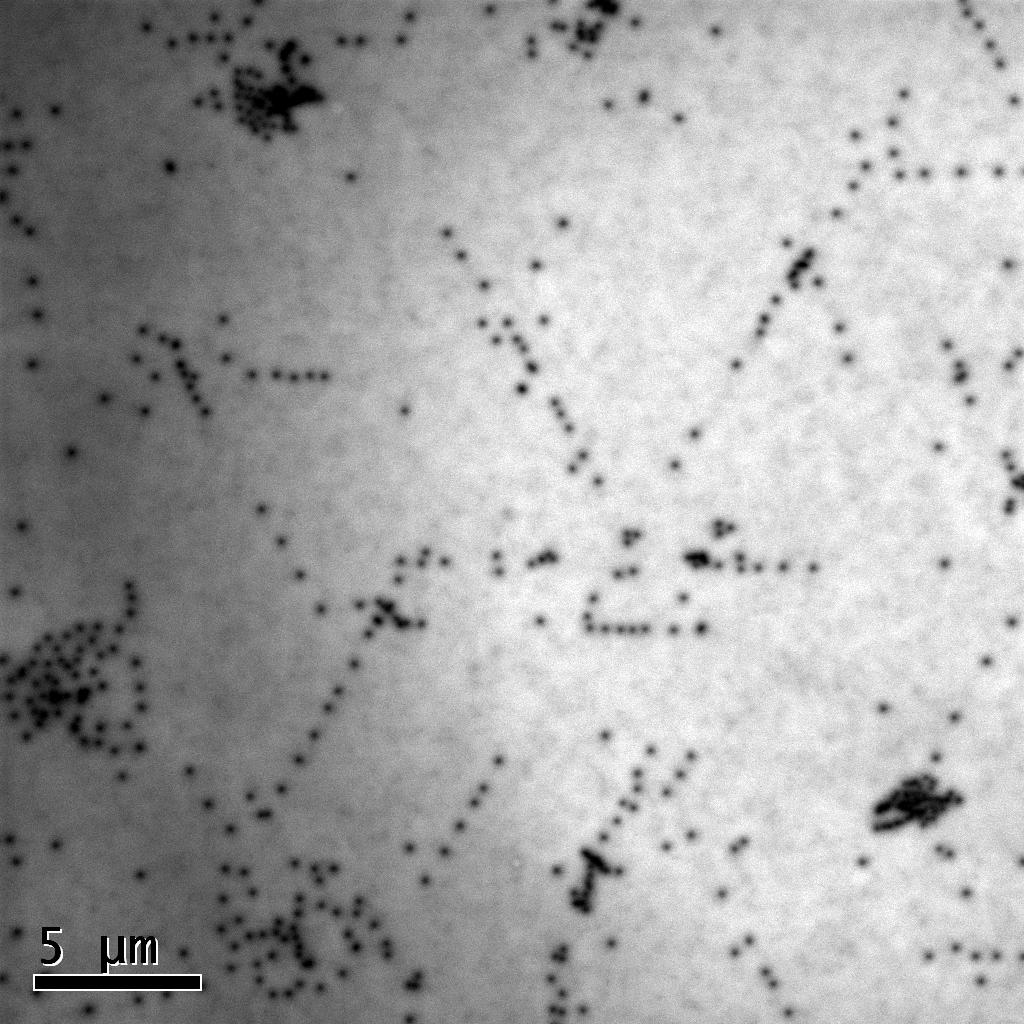
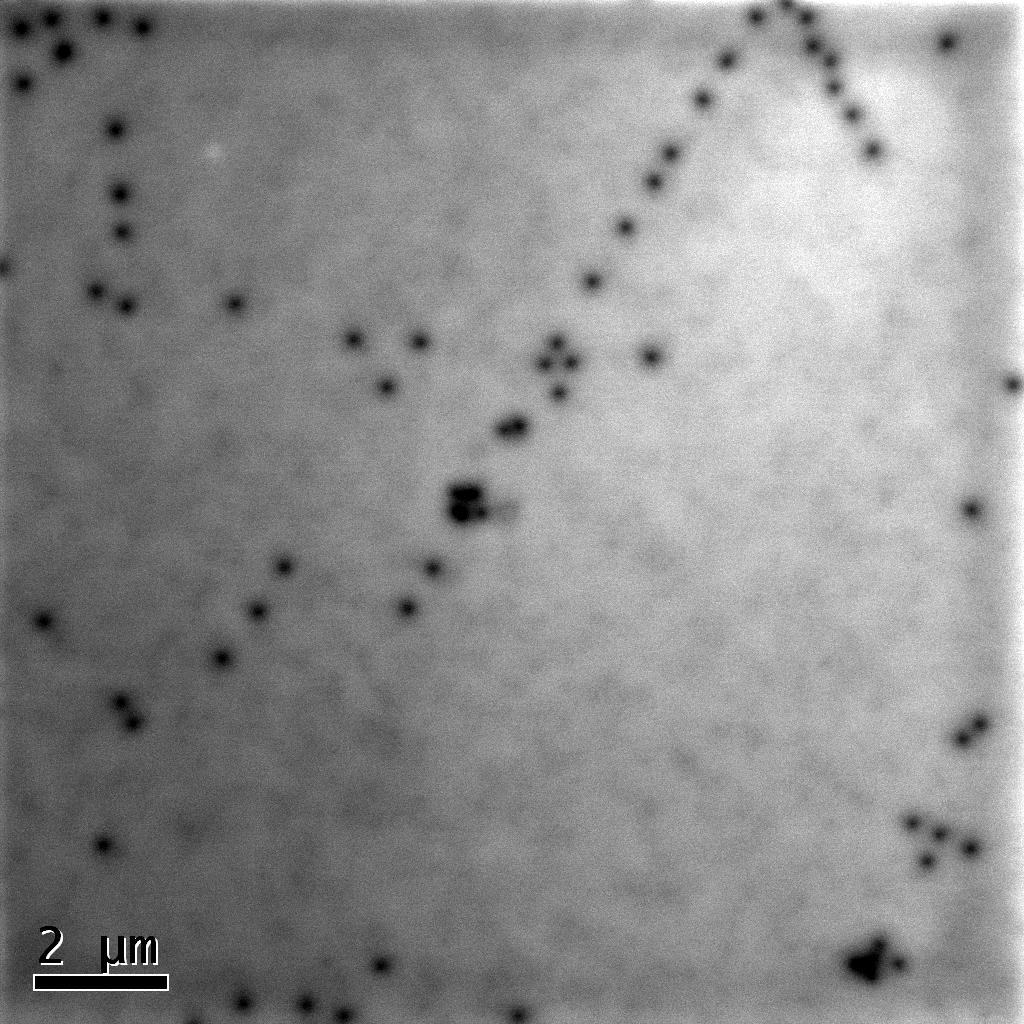
Panchromatic Cathodoluminescence image obtained on the region E on the ELOG template. Used to calculate dislocation density reported in Fig8
Panchromatic_CL_RegionE_f.jpg
image/jpeg (158kB)
Creative Commons: Attribution 4.0
Panchromatic_CL_RegionE_f.jpg
image/jpeg (158kB)
Creative Commons: Attribution 4.0
Panchromatic_CL_RegionE_g.jpg
image/jpeg (188kB)
Creative Commons: Attribution 4.0
Panchromatic Cathodoluminescence image obtained on the region E on the ELOG template. Used to calculate dislocation density reported in Fig8
Panchromatic_CL_RegionE_h.jpg
image/jpeg (156kB)
Creative Commons: Attribution 4.0
Panchromatic Cathodoluminescence image obtained on the region E on the ELOG template. Used to calculate dislocation density reported in Fig8
Panchromatic_CL_RegionE_i.jpg
image/jpeg (200kB)
Creative Commons: Attribution 4.0
Panchromatic Cathodoluminescence image obtained on the region E on the ELOG template. Used to calculate dislocation density reported in Fig8
Panchromatic_CL_RegionE_j.jpg
image/jpeg (179kB)
Creative Commons: Attribution 4.0
Panchromatic Cathodoluminescence image obtained on the region E on the ELOG template. Used to calculate dislocation density reported in Fig8
Panchromatic_CL_RegionE_k.jpg
image/jpeg (189kB)
Creative Commons: Attribution 4.0
Panchromatic Cathodoluminescence image obtained on the region E on the ELOG template. Used to calculate dislocation density reported in Fig8
Panchromatic_CL_RegionE_k.jpg
image/jpeg (189kB)
Creative Commons: Attribution 4.0
Panchromatic Cathodoluminescence image obtained on the region E on the ELOG template. Used to calculate dislocation density reported in Fig8
Panchromatic_CL_RegionE_l.jpg
image/jpeg (191kB)
Creative Commons: Attribution 4.0
Panchromatic Cathodoluminescence image obtained on the region E on the ELOG template. Used to calculate dislocation density reported in Fig8
Fig8_ELOG_pendeo … data.xlsx
application/vnd.openxmlformats-officedocument.spreadsheetml.sheet (13kB)
Creative Commons: Attribution 4.0
Raw data used to draw figure 8
Fig9_raw_data … E2h_Raman.xlsx
application/vnd.openxmlformats-officedocument.spreadsheetml.sheet (9kB)
Creative Commons: Attribution 4.0
Raw data used to draw figure 9
Fig2a_AreaVsGrowthTimeData.txt
text/plain (285B)
Creative Commons: Attribution 4.0
Data used to plot Figure 2a
Fig2b_AreaVsangle.txt
text/plain (359B)
Creative Commons: Attribution 4.0
Data used to plot Figure 2b
Creators
Philip Shields
University of Bath
Emmanuel Le Boulbar
University of Bath
Juraj Priesol
Slovak University of Technology in Bratislava
Alexander Šatka
Slovak University of Technology in Bratislava
Mohammad Nouf-Allehiani
University of Strathclyde
Gunasekar Naresh-Kumar
University of Strathclyde
Sophia Fox
University of Bath
Carol Trager-Cowan
University of Strathclyde
Coverage
Collection date(s):
From 2010 to 2012
Documentation
Technical details and requirements:
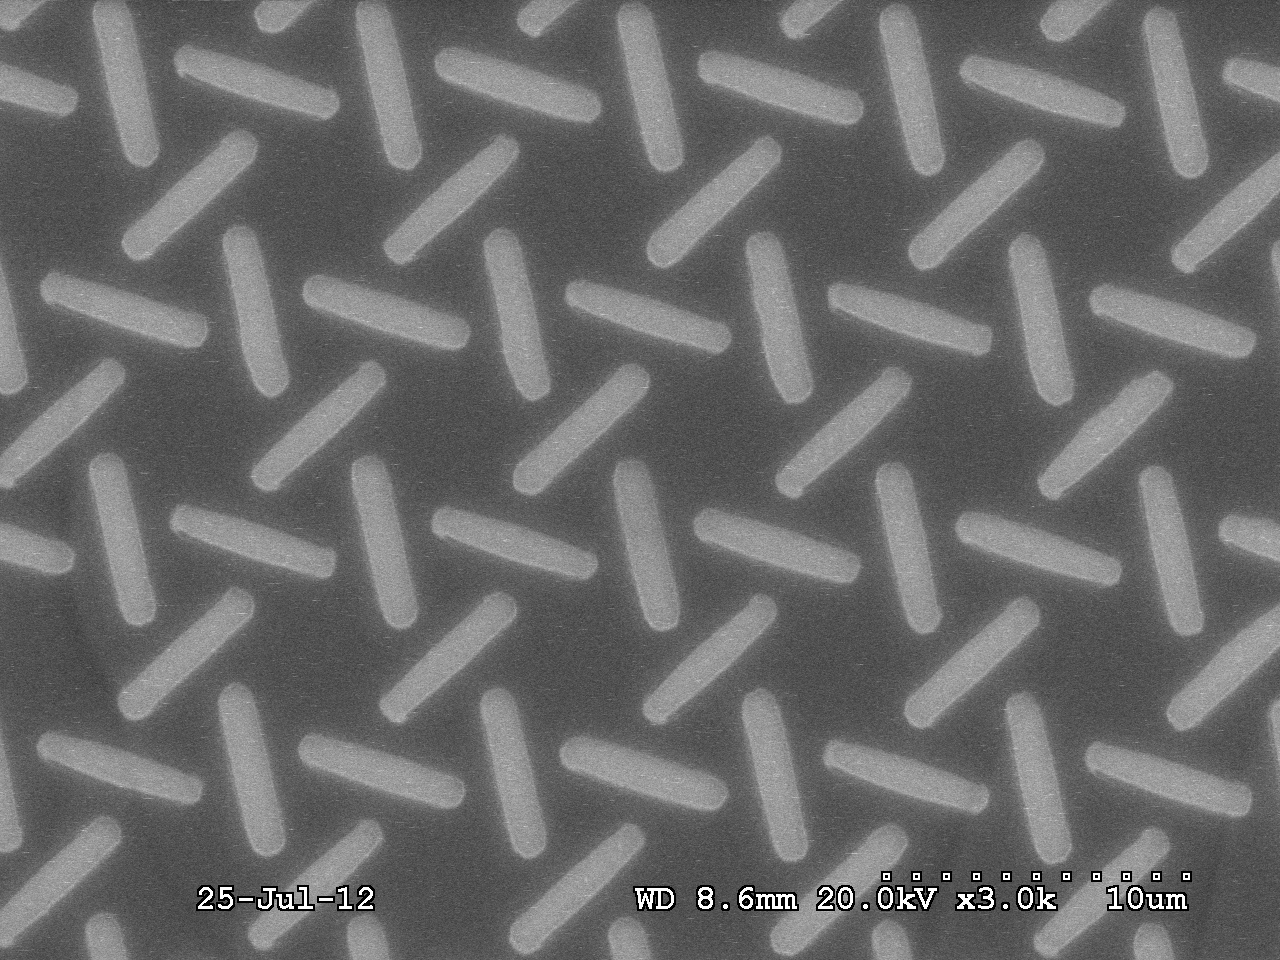
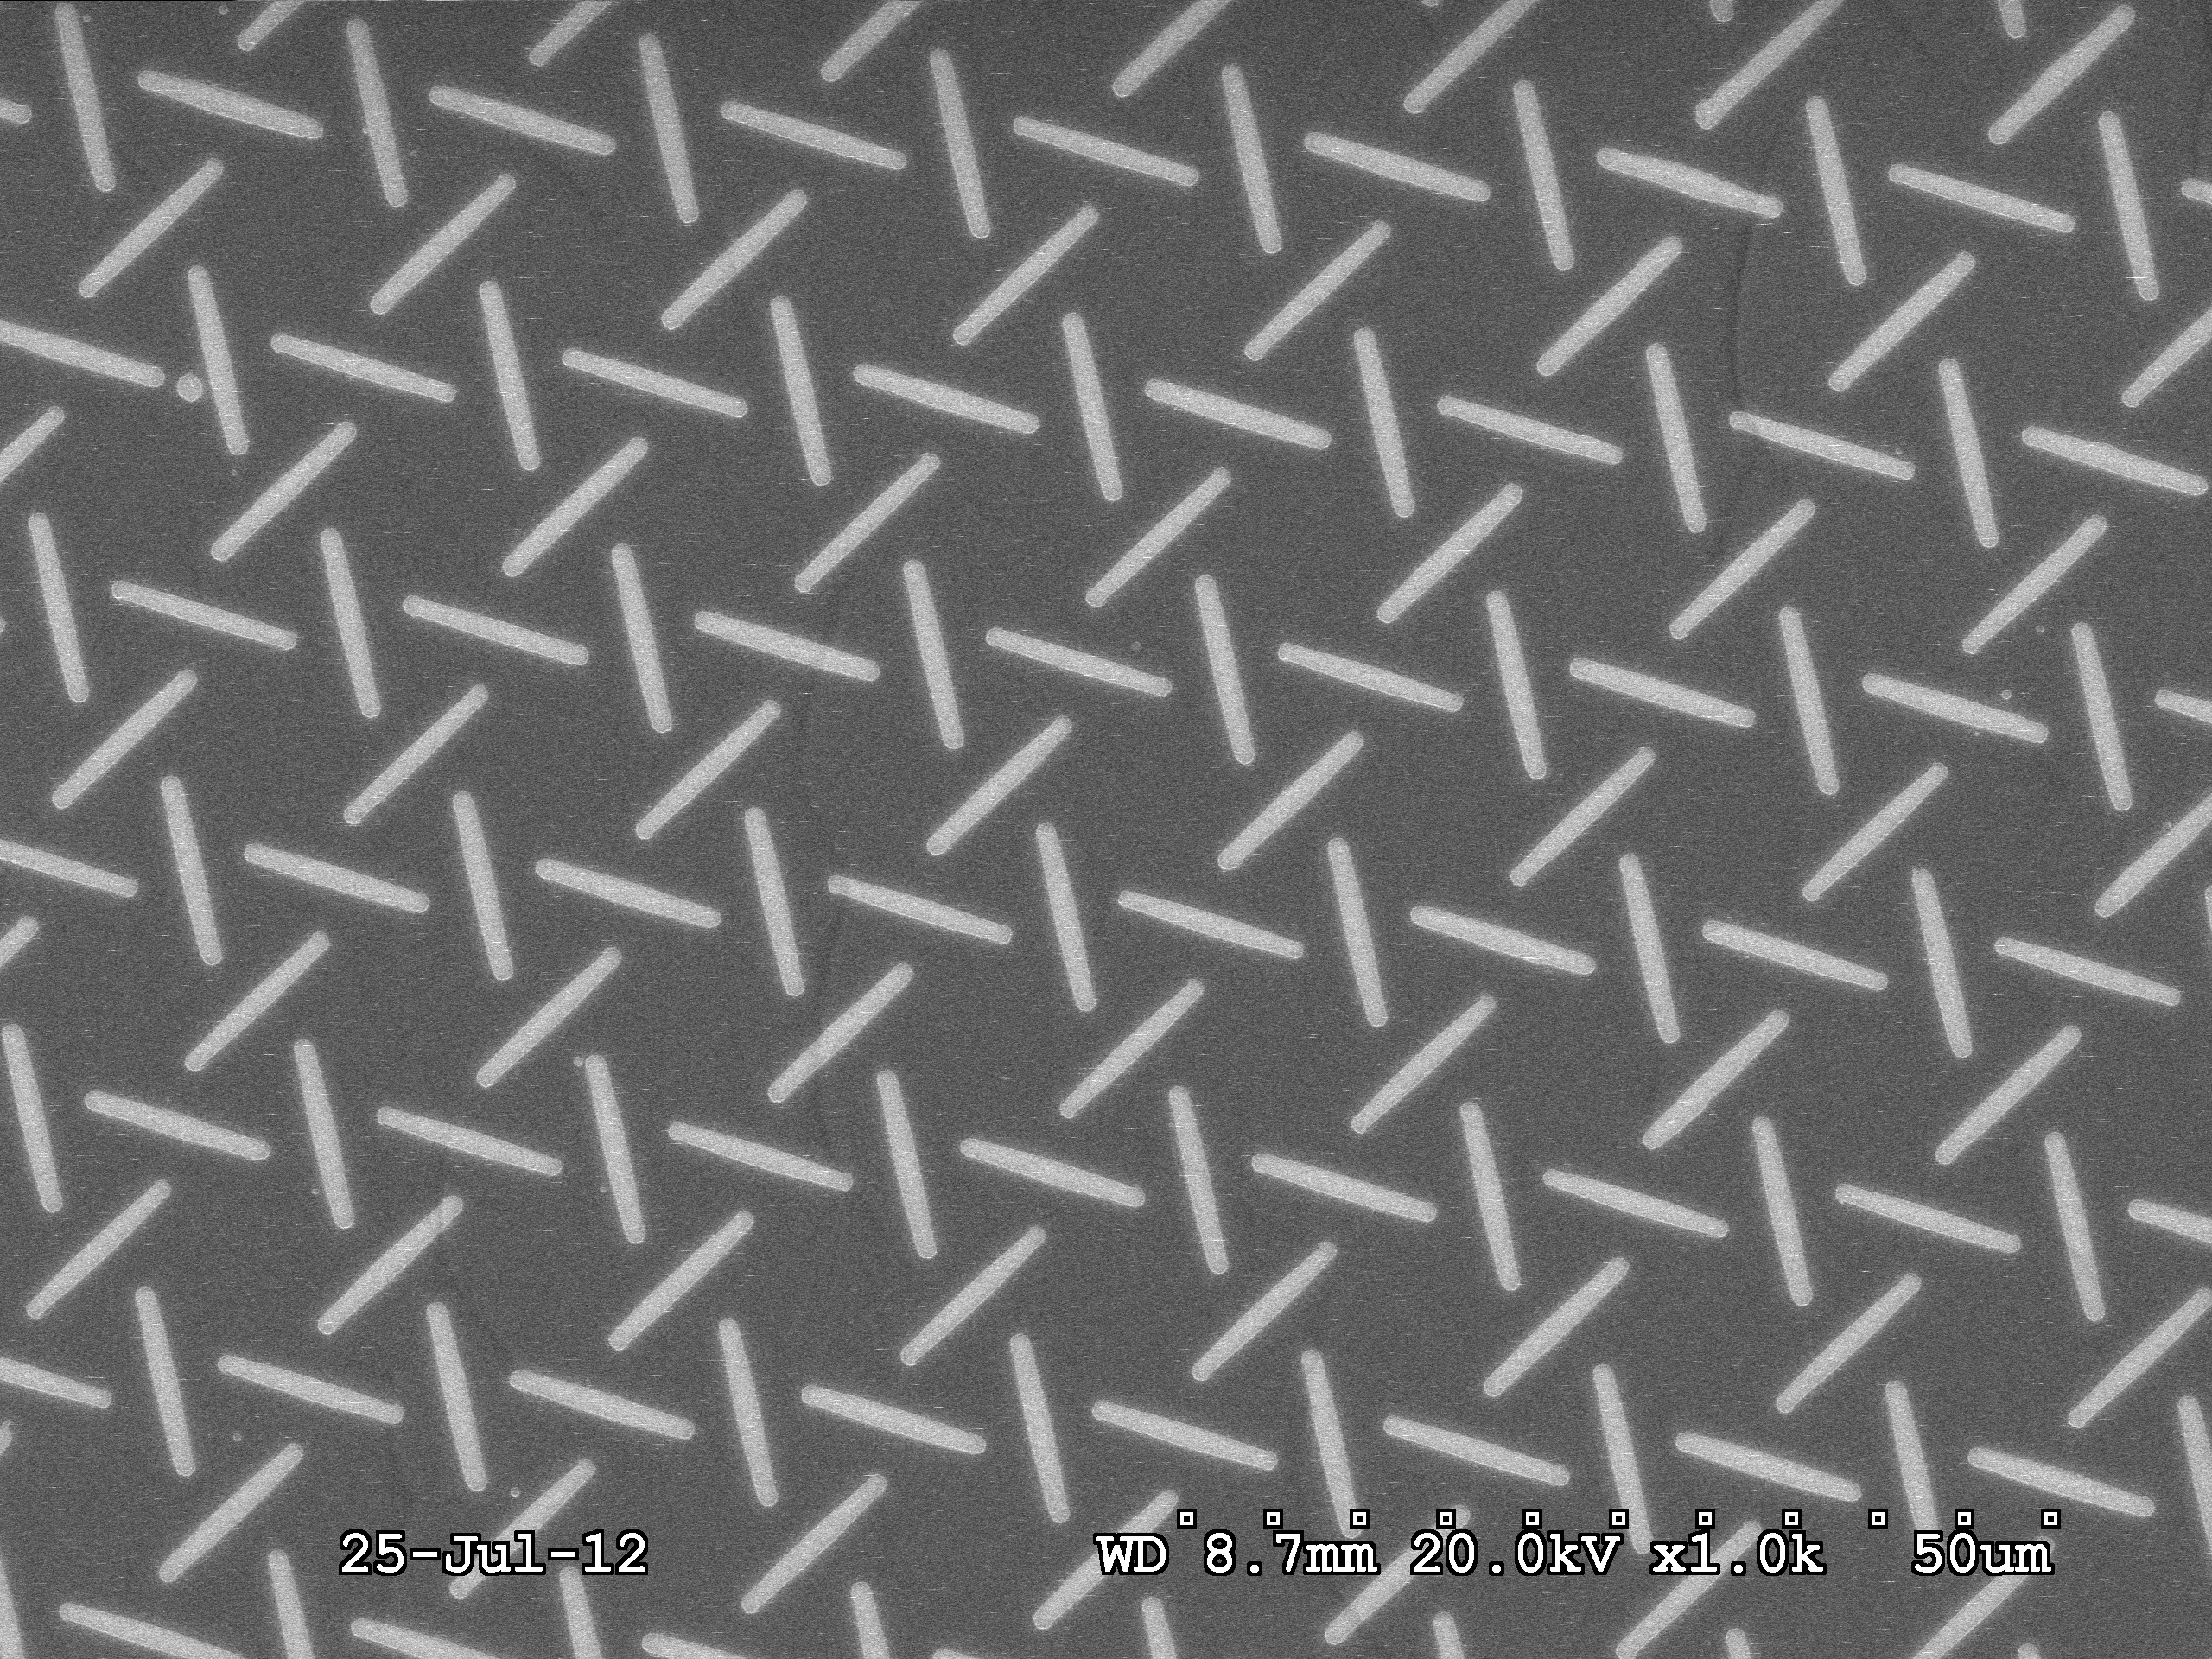
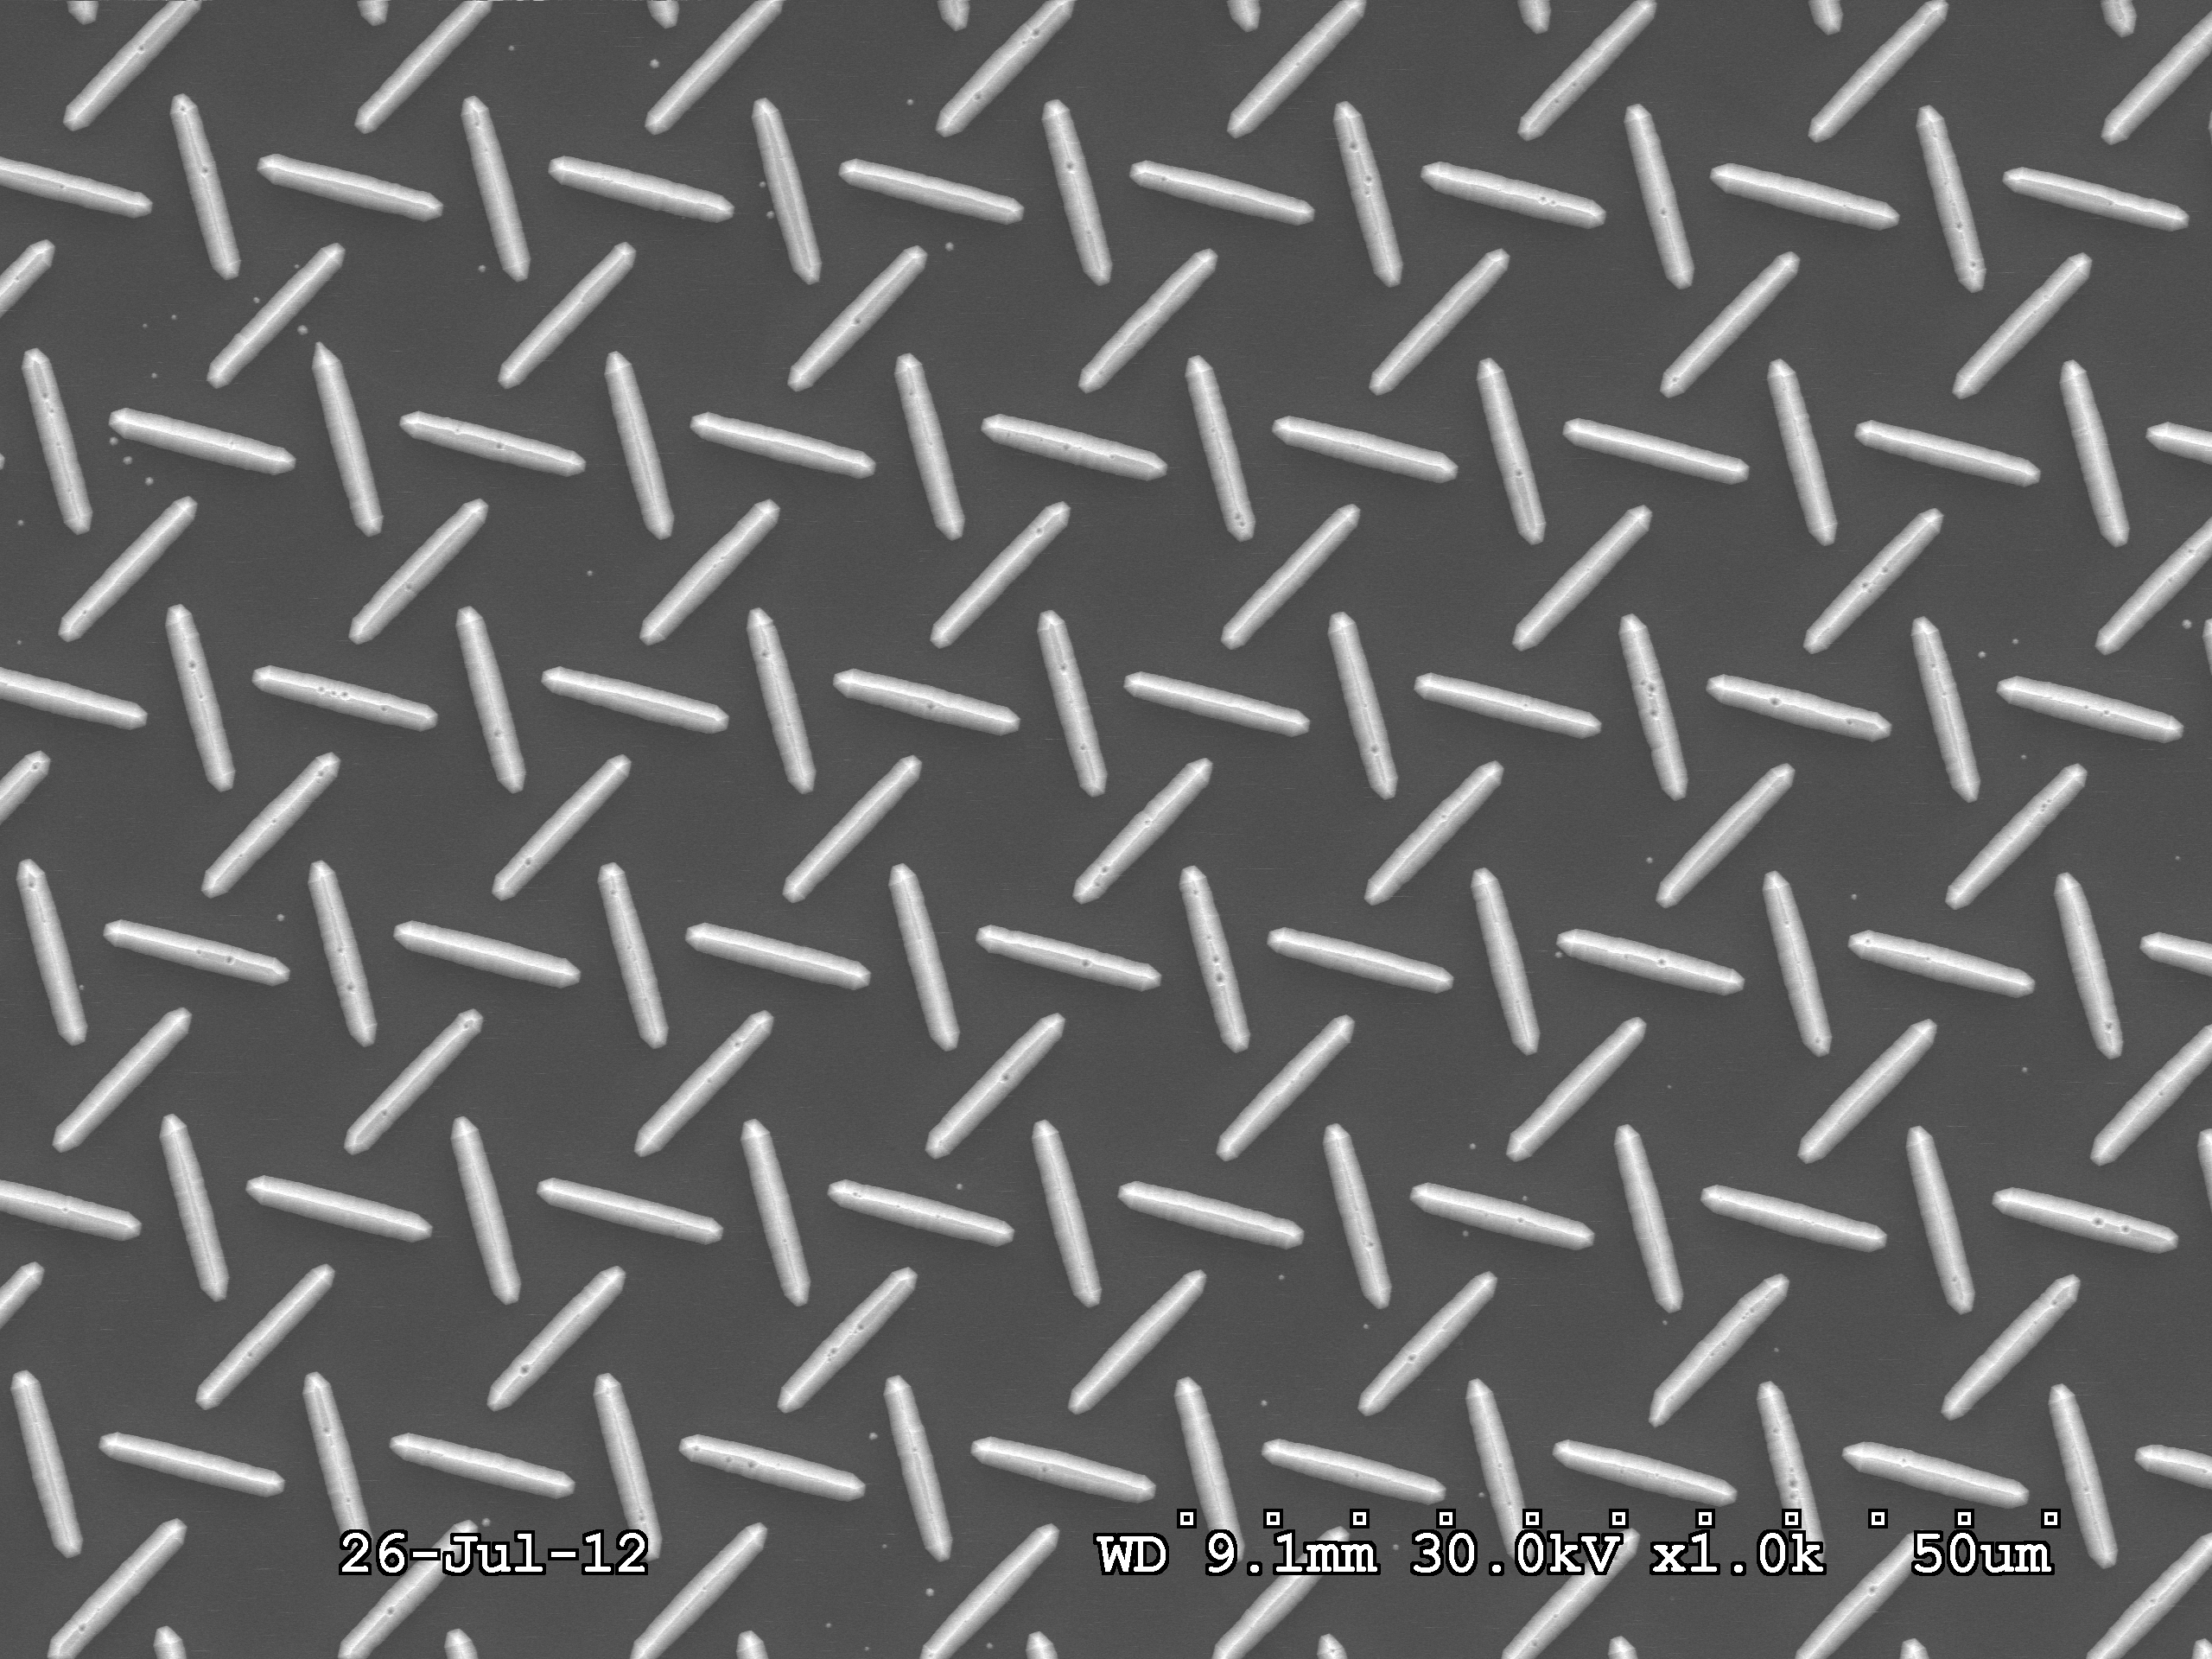
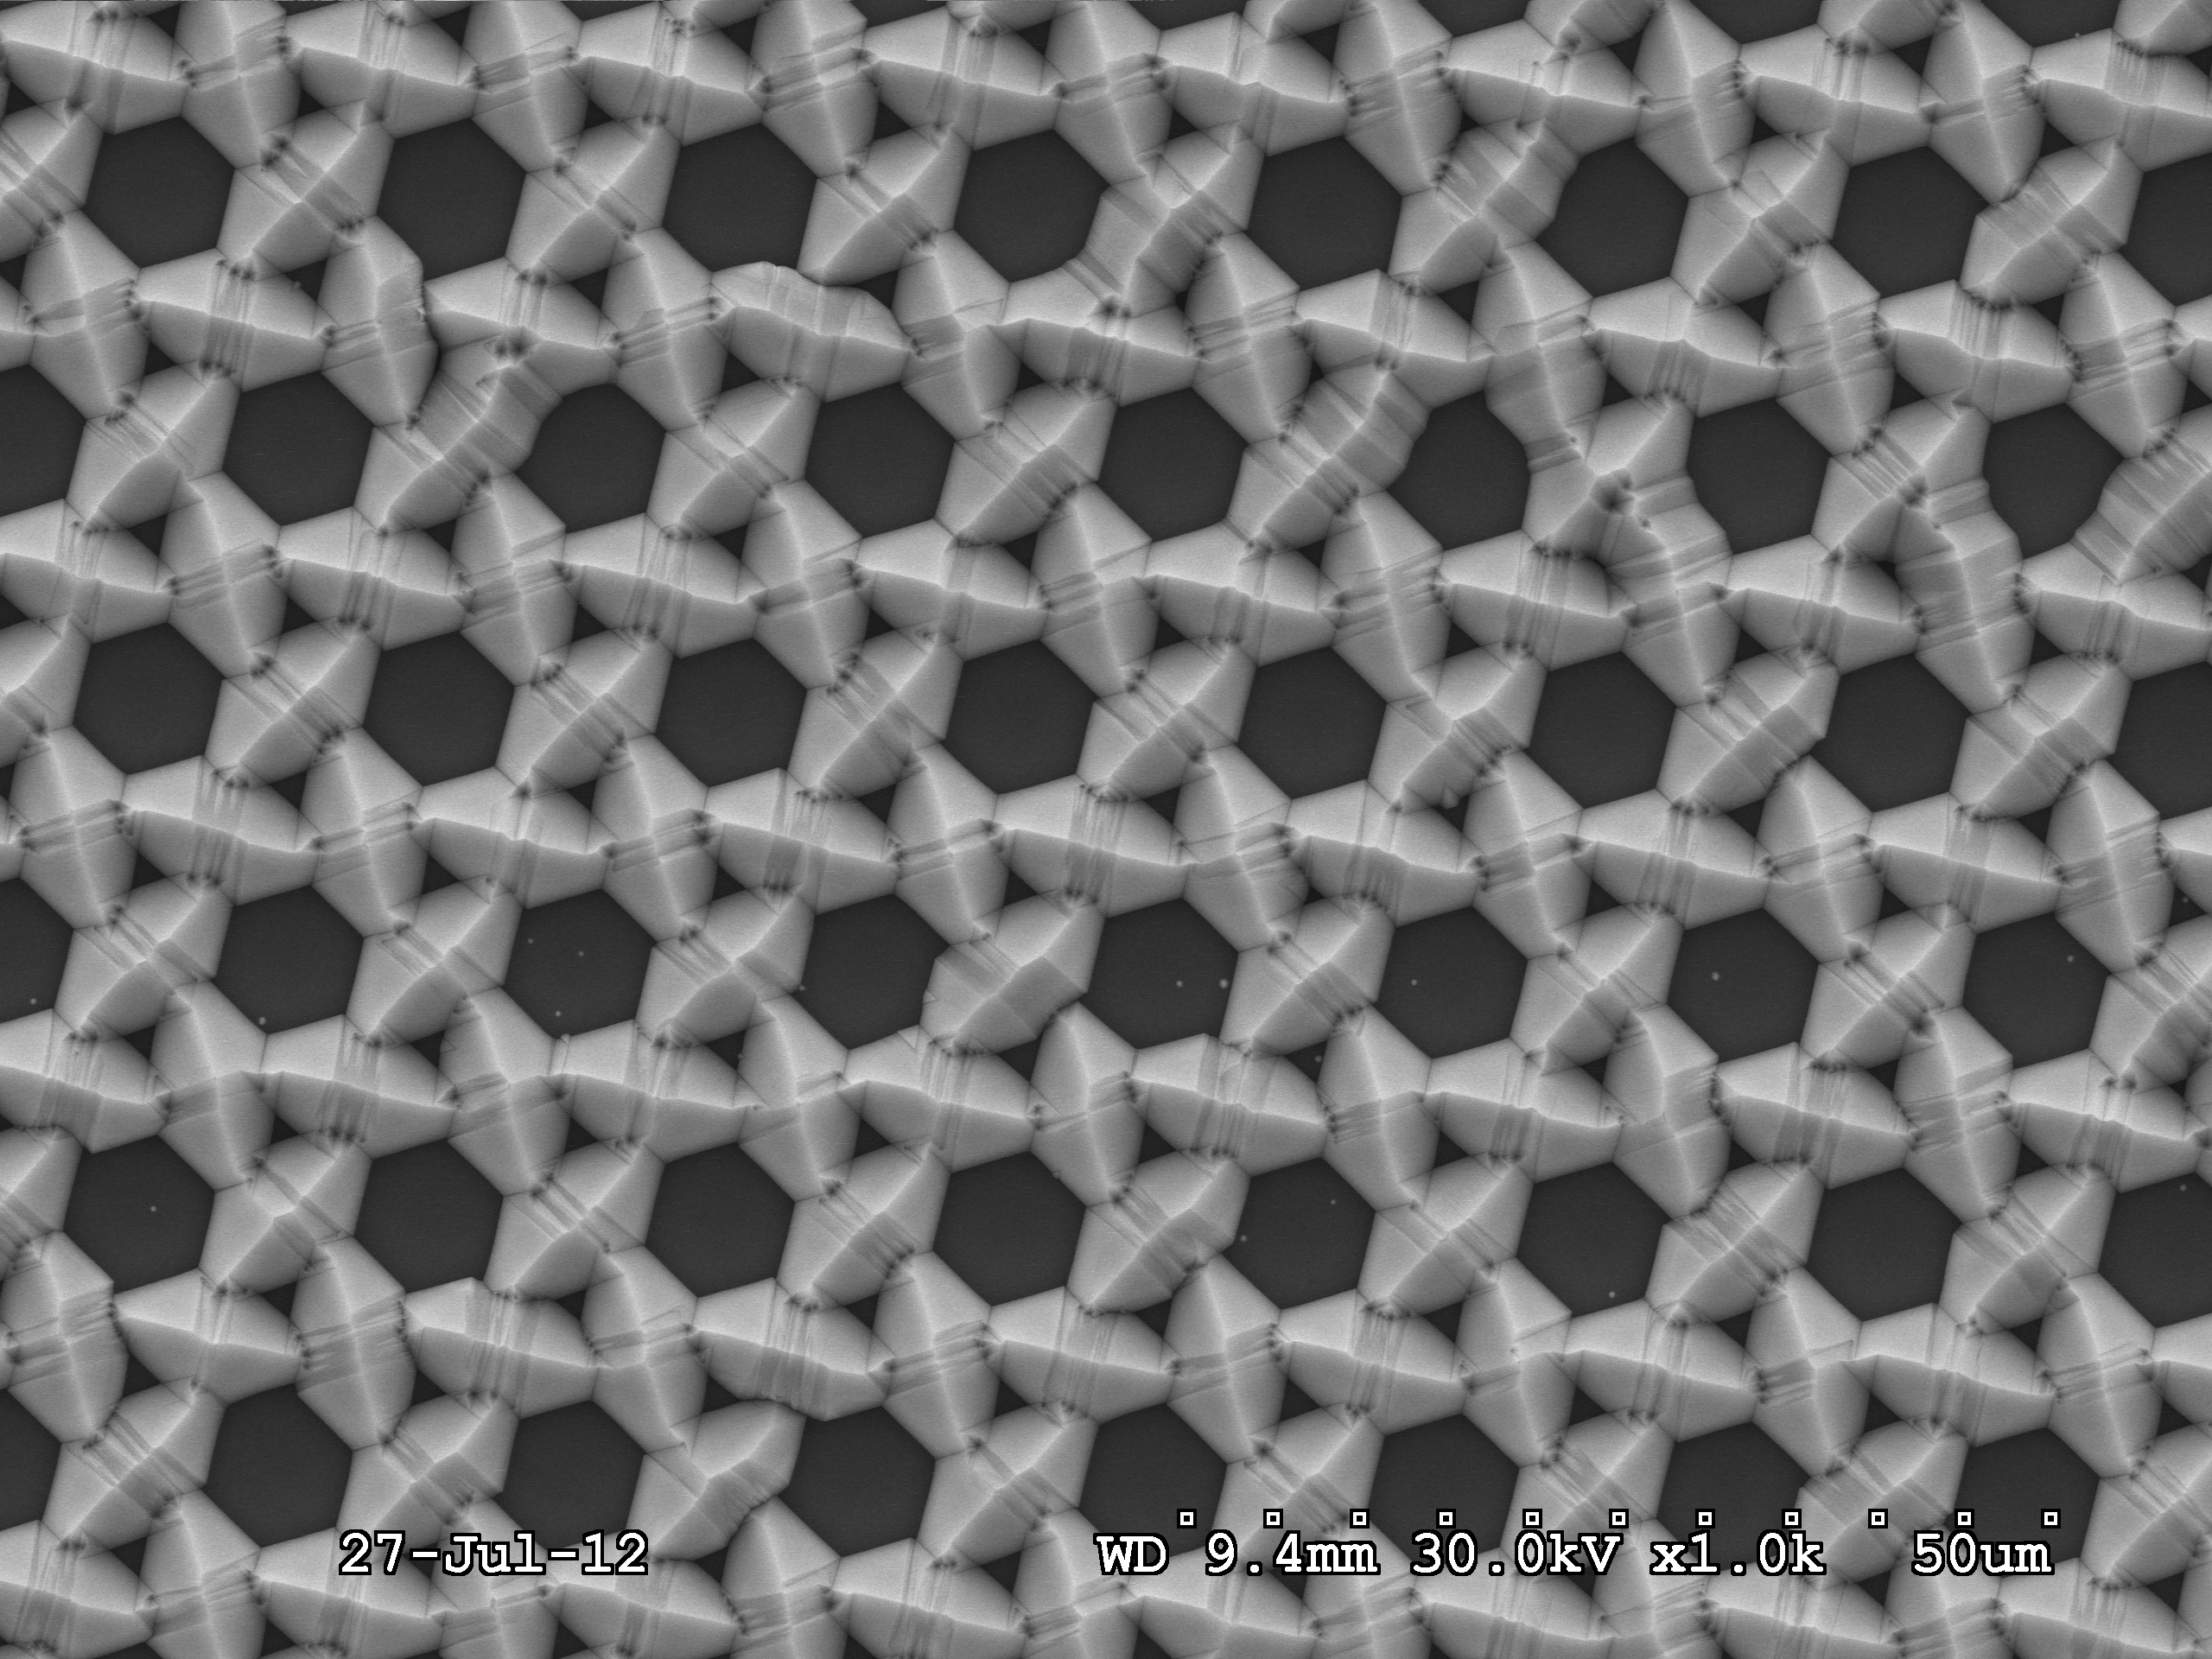
Secondary electron images were captured using a Hitachi S-4300 scanning electron microscope (SEM). An accelerating voltage of 5 kV was used to collect the images. A field-emission gun scanning electron microscopey (SEM) LEO1550 combined with a cathodoluminescence (CL) Gatan MonoCL4 detection system was employed. An electron acceleration voltage of 5 kV and a beam current below 1 nA were used to avoid the radiation damage and preserve the lateral resolution during the panchromatic SEM CL imaging. MOVPE growth were performed in a horizontal flow Aixtron 200/4HT RF-S reactor. The templates were prepared using a nanoimprinting stamp, whic was replicate on the wafer using acrylate. Chlorine/Argon chemistry was used in order to etched GaN dashes to obtain the pendeo template. CHF3 chemistry was used in order to open GaN dashes windows and obtain the ELOG template.
Funders
Seventh Framework Programme
https://doi.org/10.13039/100011102
SMASH: Smart Nanostructured Semiconductors for Energy-Saving Light Solutions
228999
Engineering and Physical Sciences Research Council
https://doi.org/10.13039/501100000266
Manufacturing of Nano-Engineered III-Nitride Semiconductors
EP/M015181/1
Publication details
Publication date: March 2017
by: University of Bath
Version: 1
DOI: https://doi.org/10.15125/BATH-00257
URL for this record: https://researchdata.bath.ac.uk/257
Related papers and books
Le Boulbar, E.D., Priesol, J., Nouf-Allehiani, M., Naresh-Kumar, G., Fox, S., Trager-Cowan, C., Šatka, A., Allsopp, D.W.E., and Shields, P.A., 2017. Design and fabrication of enhanced lateral growth for dislocation reduction in GaN using nanodashes. Journal of Crystal Growth, 466, 30-38. Available from: https://doi.org/10.1016/j.jcrysgro.2017.02.047.
Contact information
Please contact the Research Data Service in the first instance for all matters concerning this item.
Contact person: Philip Shields
Faculty of Engineering & Design
Electronic & Electrical Engineering
