Dataset for "Imaging of strong vortex pinning in GdBaCuO high temperature superconducting tapes under external fields"
This dataset contains data from the research into the vortex pinning in GdBaCuO superconducting tapes under external fields. The bulk of the data is Scanning Hall Probe Microscopy (SHPM) image files. The remainder of the data includes; electronic transport data, EDX and SEM data files and files for B-H loops.
Cite this dataset as:
Collomb, D.,
Bending, S.,
Yuan, W.,
Zhang, M.,
2021.
Dataset for "Imaging of strong vortex pinning in GdBaCuO high temperature superconducting tapes under external fields".
Bath: University of Bath Research Data Archive.
Available from: https://doi.org/10.15125/BATH-00945.
Export
Data
B_H_107mT.zip
application/zip (95kB)
Creative Commons: Attribution 4.0
Here is found the high field B-H sweeps for all temperatures, each in their own .txt file. Column 1 is the applied field in Gauss while the other is the field measured by the Hall probe.
FESEM.zip
application/zip (28MB)
Creative Commons: Attribution 4.0
All field effect SEM images and the EDX images taken related to figure 1 and supplementary figure 1.
RT_1.ods
application/vnd.oasis.opendocument.spreadsheet (260kB)
Creative Commons: Attribution 4.0
Resistance-temperature data used to plot figure 2 as measured by the temperature controller and nanovolt meter.
GBCO_32G.zip
application/zip (88kB)
Creative Commons: Attribution 4.0
The low field B-H sweep data at different temperatures. Each temperature is its own text file. Column 1 is the applied field in Gauss while the other is the field measured by the Hall probe.
T_dep.zip
application/zip (307kB)
Creative Commons: Attribution 4.0
Here, .txt files for each temperature and image used for the calculation of the peak fields and full width hall maximums in figure 6. These files are best read using an SPM editing software, e.g. WSxM and Gwyddion.
Same_field_cycle_n2250mG.zip
application/zip (253kB)
Creative Commons: Attribution 4.0
Image files for the two same-field cycles used in figure 5 in .stp format.
Montage_comp.zip
application/zip (148kB)
Creative Commons: Attribution 4.0
Image files in the .txt format used for figure 4.
Gating_data.zip
application/zip (143kB)
Creative Commons: Attribution 4.0
Gating image files in the .txt format.
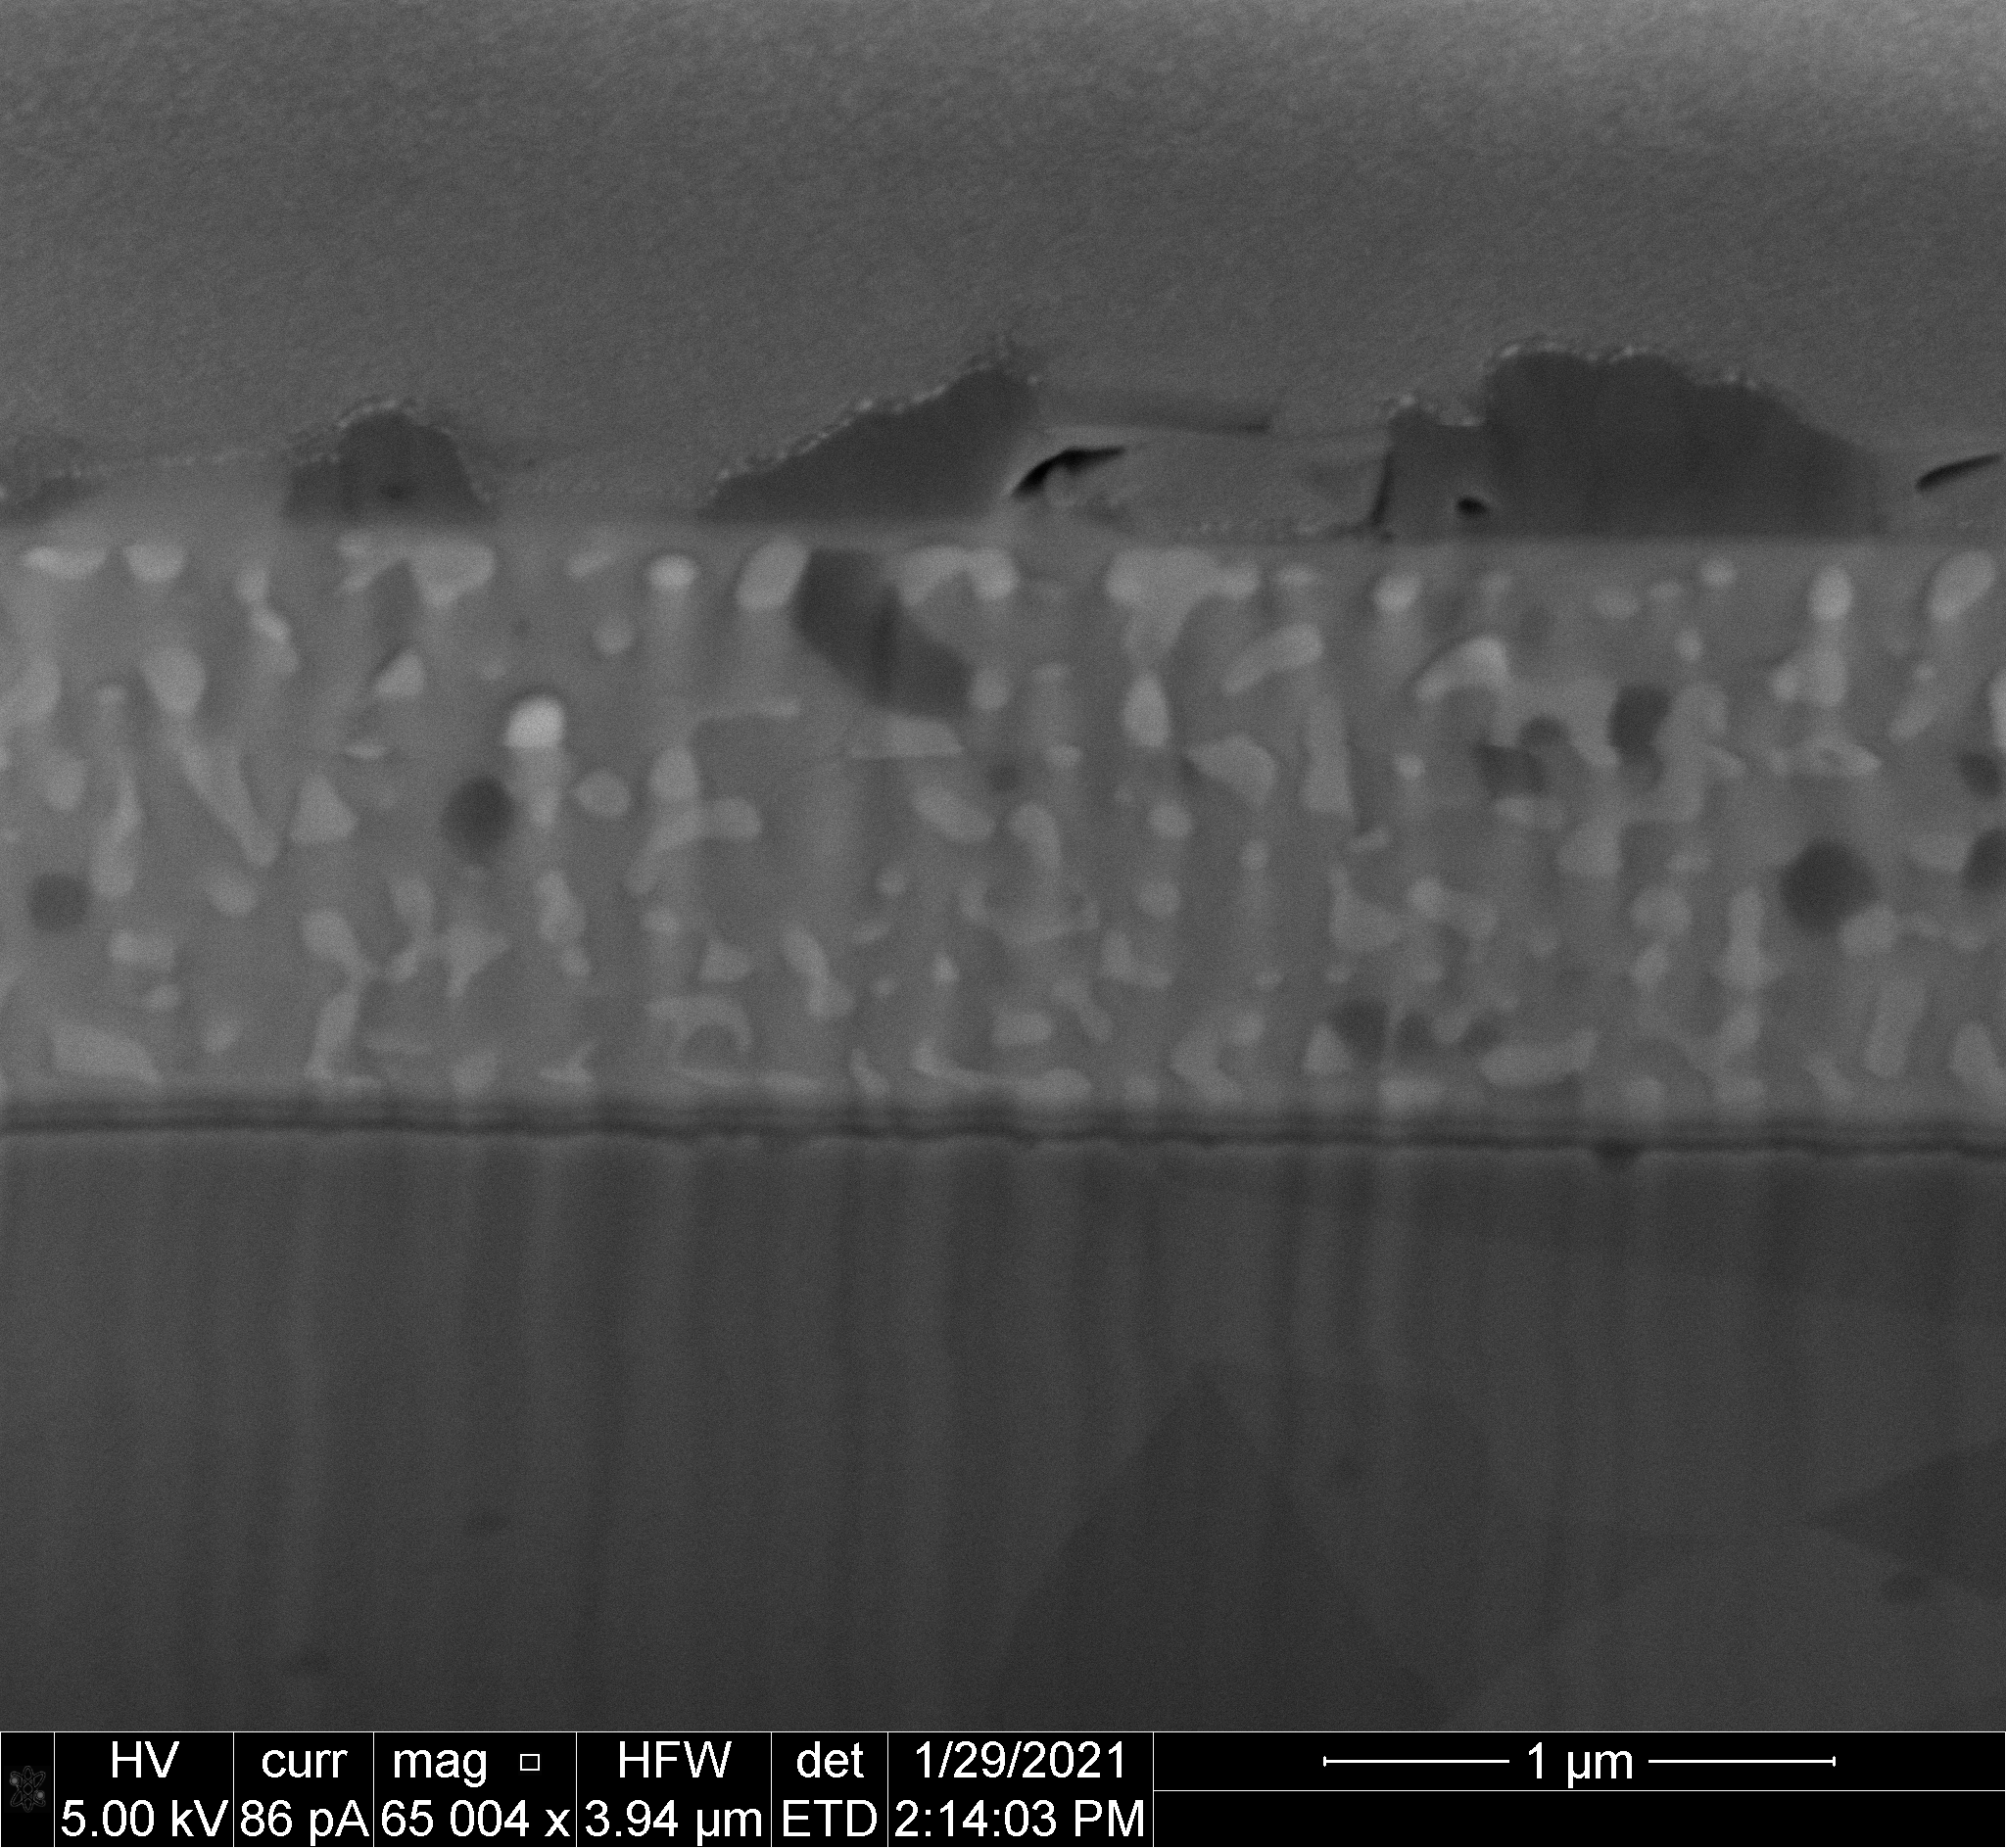
Area 1_001.png
image/png (3MB)
Creative Commons: Attribution 4.0
Image file of a cross section of the HTS layer taken after Focused Ion Beam milling.
Creators
David Collomb
University of Bath
Simon Bending
University of Bath
Weijia Yuan
University of Strathclyde
Min Zhang
University of Strathclyde
Contributors
University of Bath
Rights Holder
Coverage
Collection date(s):
From 1 April 2020 to 6 December 2020
Documentation
Data collection method:
The data was acquired by scanning Hall microscopy (SHM) in the rapid 'flying' mode that makes a rapid 2D magnetic scan of the maximum field of view. The data files consist of individual SHM images collected during these scans along with the appropriate text files for their averages. B-H loops were measured via the SHPM in fields up to 107mT and 3.2mT. Transport data was performed in an Oxford Instruments Cryostat cooled by liquid Nitrogen. A current of 10mA was supplied while the voltage was measured using a Keithley 182 nanovoltmeter as the temperature was swept at 0.1K/min using an OI ITC 503 temperature controller. Field Effect Scanning Electron Microscopy (FE-SEM) at 5kV and 1kV and Energy Dispersive X-Ray Analysis (EDX) at 10kV were performed in a Joel JSM-6301F FE-SEM.
Data processing and preparation activities:
The SHM image data in the archive are raw as-captured data without any post-processing.
Technical details and requirements:
SHM image datasets are formatted as the magnetic induction in Gauss measured at each point on a 1 128× 128 array of pixel positions. Temperature was varied between 10K and 88K. The scan area changes between temperatures with the following fitting: Area=(-1.037e-08*Temperature^4 + 5.547e-06*Temperature^3 + -0.0009229*Temperature^2 + 0.2264*Temperature + 6.483) EDX data must be viewed via Oxford Instruments analysis suite.
Funders
Engineering and Physical Sciences Research Council
https://doi.org/10.13039/501100000266
Graphene Nanosensors for Scanning Hall Microscopy and Susceptometry
EP/R007160/1
Lloyd's Register Foundation
https://doi.org/10.13039/100008885
Graphene-Hall-effect nanosensors to optimise high current superconducting tapes for applications in ‘smart’ power grids
G0086
European Cooperation in Science and Technology
https://doi.org/10.13039/501100000921
Nanoscale Coherent Hybrid Devices For Superconducting Quantum Technologies (NANOCOHYBRI)
CA16218
Publication details
Publication date: 21 April 2021
by: University of Bath
Version: 1
DOI: https://doi.org/10.15125/BATH-00945
URL for this record: https://researchdata.bath.ac.uk/945
Related papers and books
Collomb, D., Zhang, M., Yuan, W., and Bending, S. J., 2021. Imaging of Strong Nanoscale Vortex Pinning in GdBaCuO High-Temperature Superconducting Tapes. Nanomaterials, 11(5), 1082. Available from: https://doi.org/10.3390/nano11051082.
Contact information
Please contact the Research Data Service in the first instance for all matters concerning this item.
Contact person: David Collomb
Faculty of Science
Physics
Research Centres & Institutes
Centre for Nanoscience and Nanotechnology
